 1:
 2:
 3:
 4:
 5:
 6:
 7:
 8:
 9:
 10:
 11:
 12:
 13:
 14:
 15:
 16:
 17:
 18:
 19:
 20:
 21:
 22:
 23:
 24:
 25:
 26:
 27:
 28:
 29:
 30:
 31:
 32:
 33:
 34:
 35:
 36:
 37:
 38:
 39:
 40:
 41:
 42:
 43:
 44:
 45:
 46:
 47:
 48:
 49:
 50:
 51:
 52:
 53:
 54:
 55:
 56:
 57:
 58:
 59:
 60:
 61:
 62:
 63:
 64:
 65:
 66:
 67:
 68:
 69:
 70:
 71:
 72:
 73:
 74:
 75:
 76:
 77:
 78:
 79:
 80:
 81:
 82:
 83:
 84:
 85:
 86:
 87:
 88:
 89:
 90:
 91:
 92:
 93:
 94:
 95:
|
###########################################################
# Setting Up Plot Areas
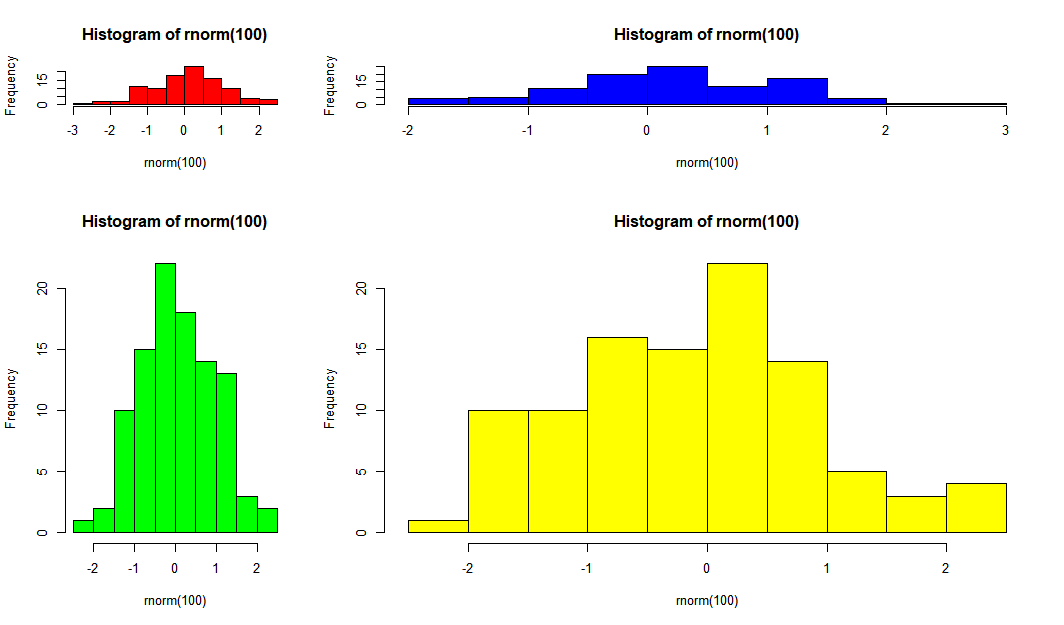
plotOrder = matrix(c(1,2,3,4),nrow=2); plotOrder
layout(plotOrder, width=c(3, 7), height=c(3, 7))

hist(rnorm(100), col="red");
hist(rnorm(100), col="green");
hist(rnorm(100), col="blue");
hist(rnorm(100), col="yellow");


###########################################################
# Set margin areas in a single layout
layout(1)
par(mar=c(3, 3, 3, 3))

# Make a blank plot
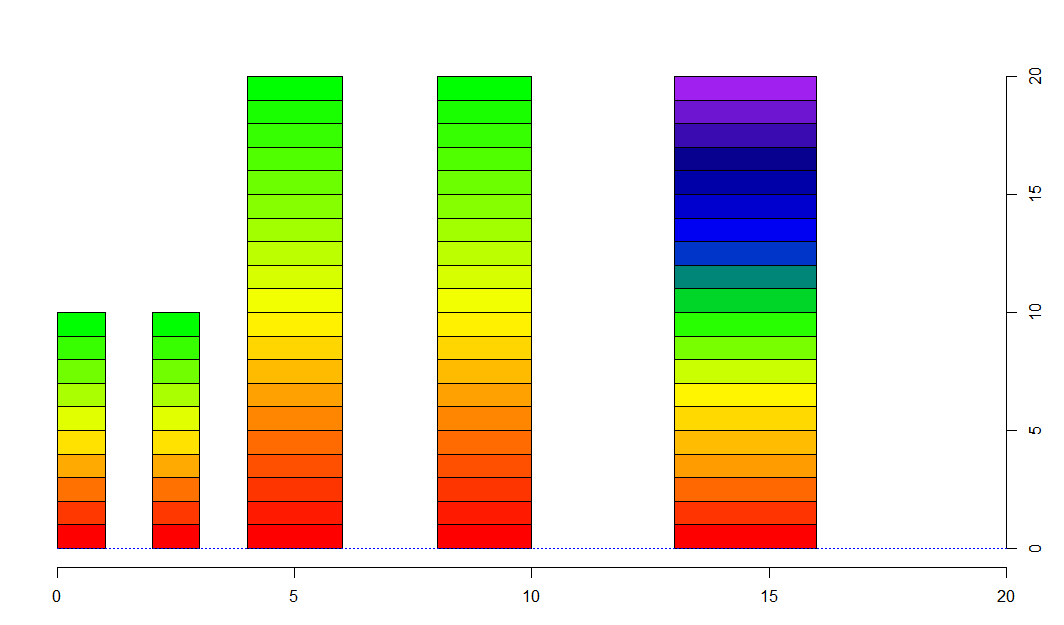
plot(NA, ylim = c(0, 20), xlim=c(0,20), axes=F, ann=F, xaxs="i")
axis(1); axis(4)
colors10   = colorRampPalette(c("red", "yellow", "green"))(10)
colors20   = colorRampPalette(c("red", "yellow", "green"))(20)
rainbowCol = colorRampPalette(c("red", "orange", "yellow", "green", "blue", "blue4", "purple"))(20)
rect(0,  0:9,   1, 1:10, col = colors10)
rect(2,  0:9,   3, 1:10, col = colors10)
rect(4,  0:19,  6, 1:20, col = colors20)
rect(8,  0:19, 10, 1:20, col = colors20)
rect(13, 0:19, 16, 1:20, col = rainbowCol)
abline(h=0, lty=21, col="blue")


###########################################################
# Set margin areas in a single layout
layout(1); par(mar=c(3, 3, 3, 3))

# Make a blank plot
plot(NA, ylim = c(0, 8), xlim=c(0,256), axes=F, ann=F, xaxs="i")
axis(1); axis(4)

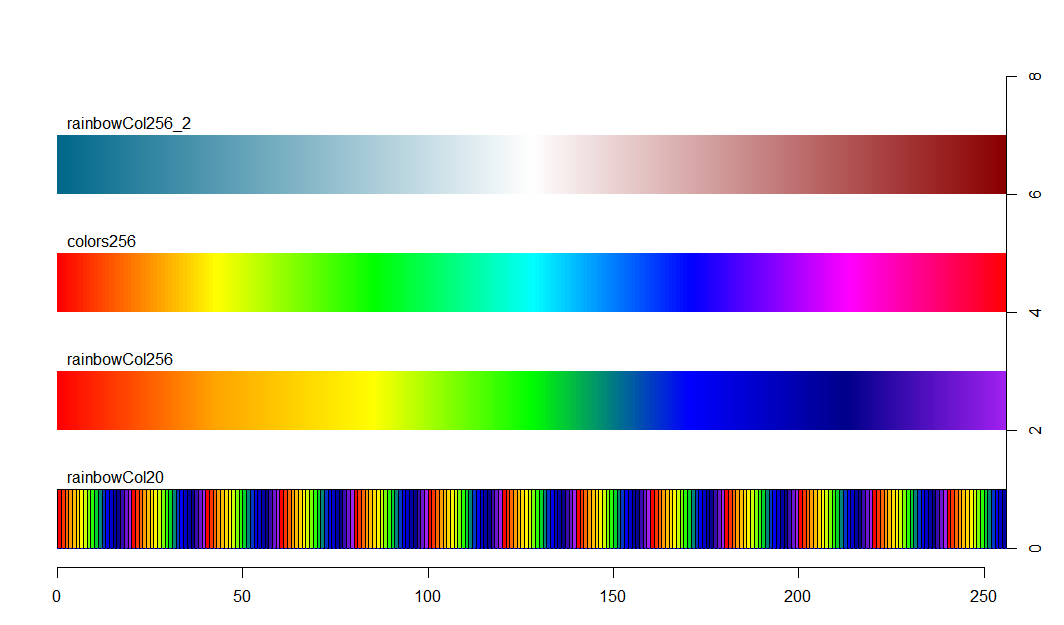
rainbowCol20  = colorRampPalette(c("red", "orange", "yellow", "green", "blue", "blue4", "purple"))(20)
rainbowCol256 = colorRampPalette(c("red", "orange", "yellow", "green", "blue", "blue4", "purple"))(256)
colors256     = colorRampPalette(c("deepskyblue4", "white", "darkred"))(256)
rect(0:255, 0, 1:256, 1, col = rainbowCol20)
rect(0:255, 2, 1:256, 3, lty=0, col = rainbowCol256)
rect(0:255, 6, 1:256, 7, lty=0, col = colors256)

rainbowCol256_2 = rainbow(256)
rect(0:255, 4, 1:256, 5, lty=0, col = rainbowCol256_2)

abline(h=0, lty=21, col="blue")
text(0, 1.2, pos=4, "rainbowCol20")
text(0, 3.2, pos=4, "rainbowCol256")
text(0, 5.2, pos=4, "colors256")
text(0, 7.2, pos=4, "rainbowCol256_2")


###########################################################
# Data
set.seed(1234)
d = data.frame (X = rnorm (1000, 0, 2), Y = rnorm (1000, 0, 2))
i = 10

# Make Ranges
d$xcat = cut (d$X, i)
d$ycat = cut (d$Y, i)
table(cut(d$X, breaks = -6:6)) # Make a Range Table

# Boundary Coordinates
bX = seq(min(d$X), max(d$X), length = i+1)
bY = seq(min(d$Y), max(d$Y), length = i+1)
bX
bY
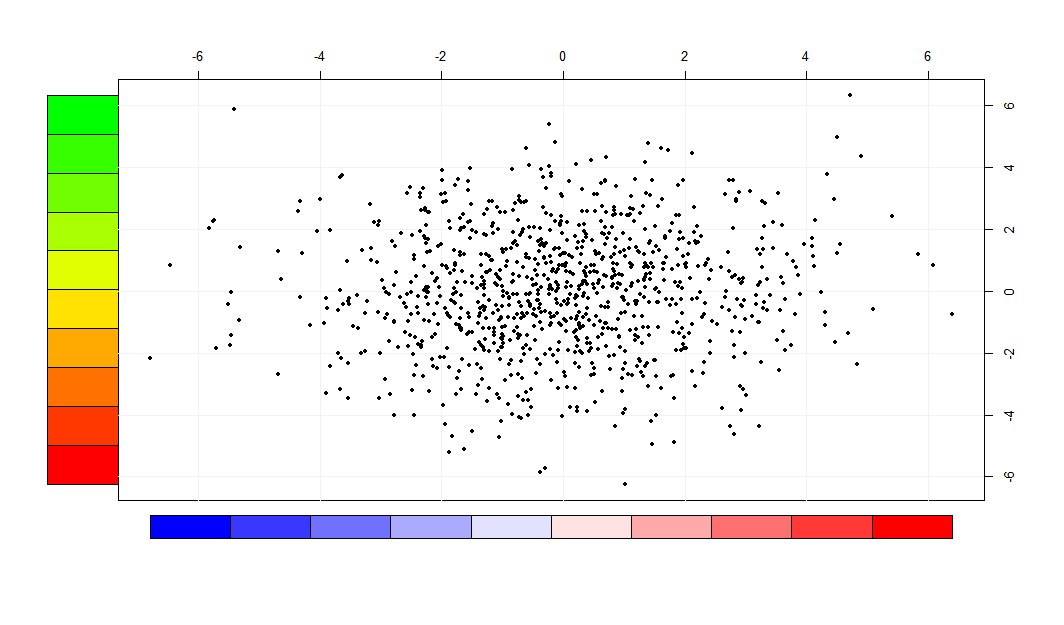
color1 = colorRampPalette(c("red","yellow","green"))(i)
color2 = colorRampPalette(c("blue","white","red"))(i)

# Plotting Order and Setting Up a Layout
layout(matrix(c(1,0,2,3),nrow=2), width=c(1,8), height=c(8,2))

# 1st Area: Left Top
par(mar=c(0,3,5,0))
plot(NA, ylim=range(d$Y), xlim=c(0, 1), axes=F, ann=F, xaxs="i")
rect(0,bY[-length(bY)], 1, bY[-1],
     col=color1)

# 2nd Area: Right Top
par(mar=c(0,0,5,5))
plot(NA,xlim=range(d$X),ylim=range(d$Y),ann=F,xaxt="n",yaxt="n")
abline(h=pretty(d$Y),v=pretty(d$X), col="grey95")
points(d$X, d$Y, pch=20)
axis(3)
axis(4)

# 3rd Area: Right Bottom
par(mar=c(3,0,0,5))
plot(NA, xlim=range(d$X), ylim=c(0,1), axes=F, ann=F, yaxs="i")
rect(bX[-length(bX)], 0.5, bX[-1], 0.8, col=color2)
|


