 1:
 2:
 3:
 4:
 5:
 6:
 7:
 8:
 9:
 10:
 11:
 12:
 13:
 14:
 15:
 16:
 17:
 18:
 19:
 20:
 21:
 22:
 23:
 24:
 25:
 26:
 27:
 28:
 29:
 30:
 31:
 32:
 33:
 34:
 35:
 36:
 37:
 38:
 39:
 40:
 41:
 42:
 43:
 44:
 45:
 46:
 47:
 48:
 49:
 50:
 51:
 52:
 53:
 54:
 55:
 56:
 57:
 58:
 59:
 60:
 61:
 62:
 63:
 64:
 65:
 66:
 67:
 68:
 69:
|
library(RColorBrewer)

###############################################
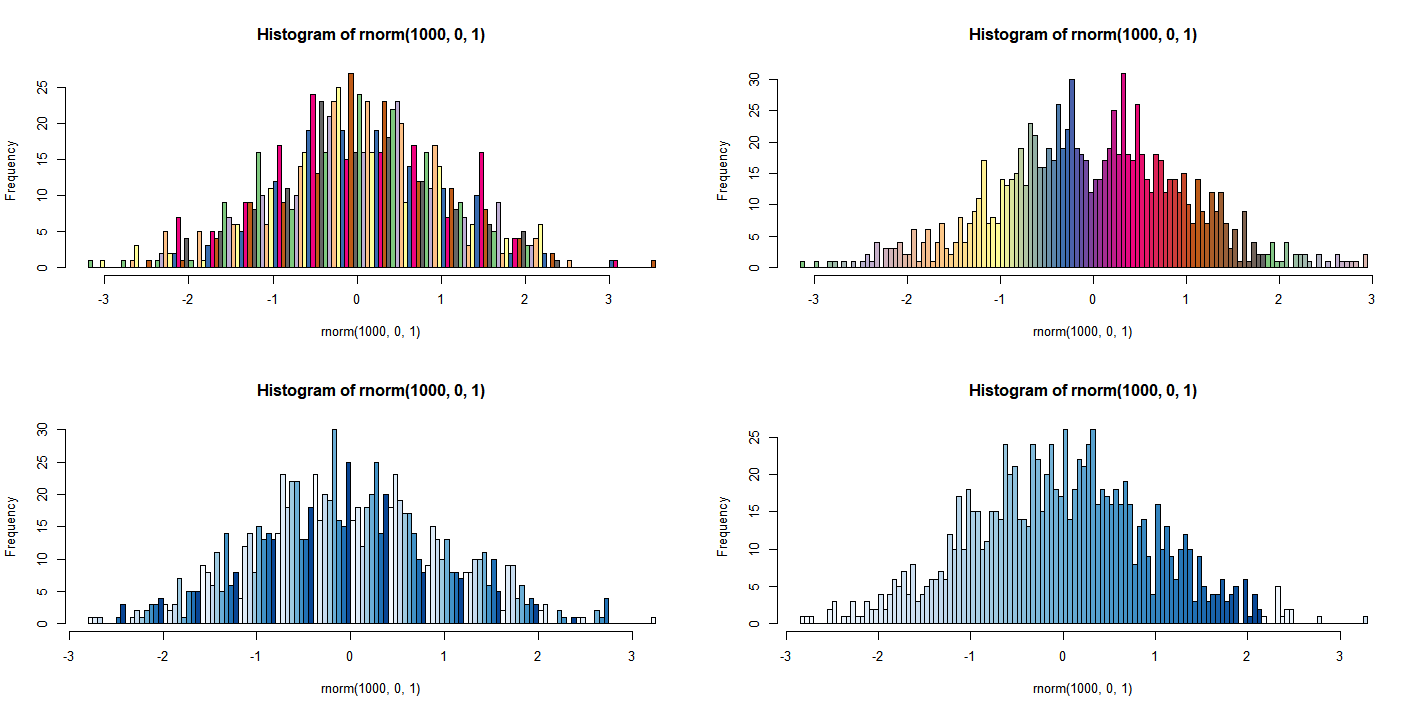
par(mfrow=c(2,2))

colors = brewer.pal(8, "Accent")  # Greens, Spectral, BrBG, Accent, Blues
hist(rnorm(1000, 0, 1), breaks=100, col=colors)
colors=colorRampPalette(colors)(100)
hist(rnorm(1000, 0, 1), breaks=100, col=colors)

colors = brewer.pal(8, "Blues")  # Greens, Spectral, BrBG, Accent, Blues
hist(rnorm(1000, 0, 1), breaks=100, col=colors)
colors=colorRampPalette(colors)(100)
hist(rnorm(1000, 0, 1), breaks=100, col=colors)

###############################################
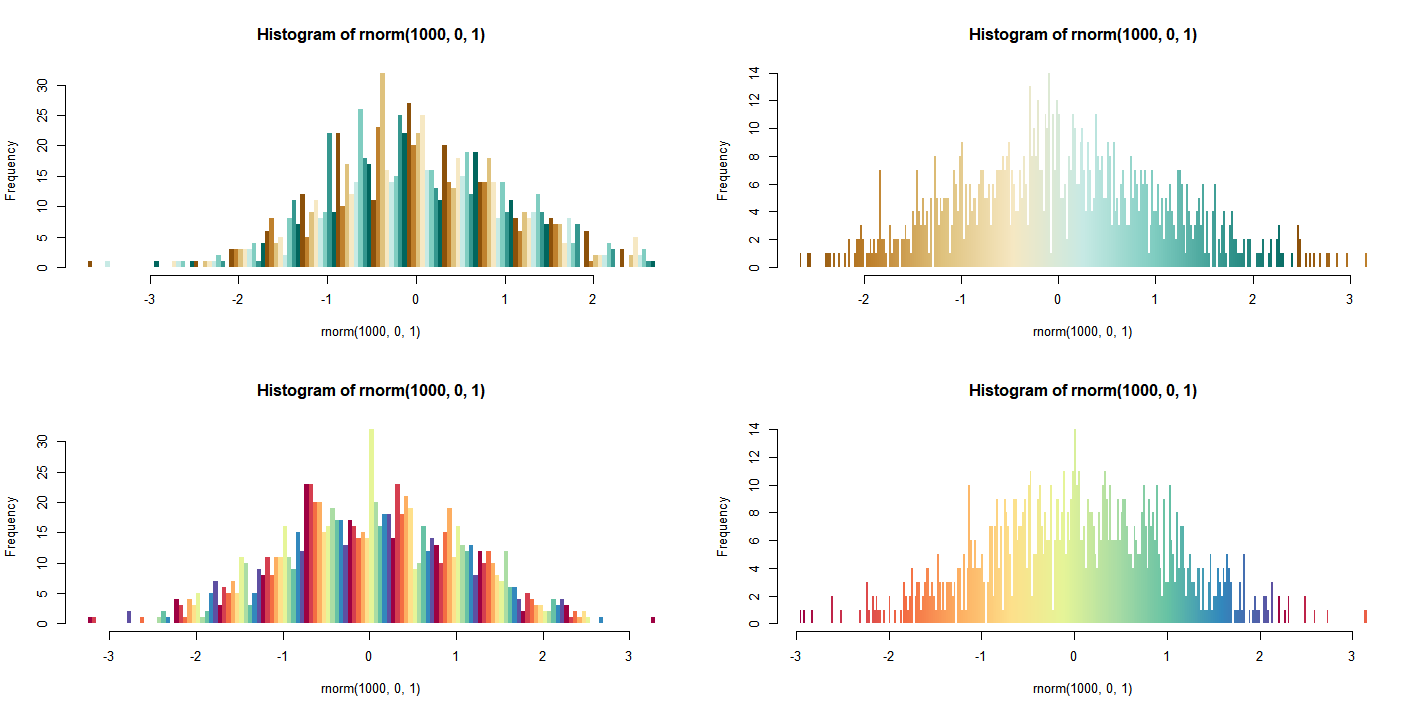
par(mfrow=c(2,2))

colors = brewer.pal(8, "BrBG")  # Greens, Spectral, BrBG, Accent, Blues
hist(rnorm(1000, 0, 1), breaks=100, col=colors, border=0)
colors=colorRampPalette(colors)(256)
hist(rnorm(1000, 0, 1), breaks=256, col=colors, border=0)

colors = brewer.pal(10, "Spectral")  # Greens, Spectral, BrBG, Accent, Blues
hist(rnorm(1000, 0, 1), breaks=100, col=colors, border=0)
colors=colorRampPalette(colors)(256)
hist(rnorm(1000, 0, 1), breaks=256, col=colors, border=0)

###############################################
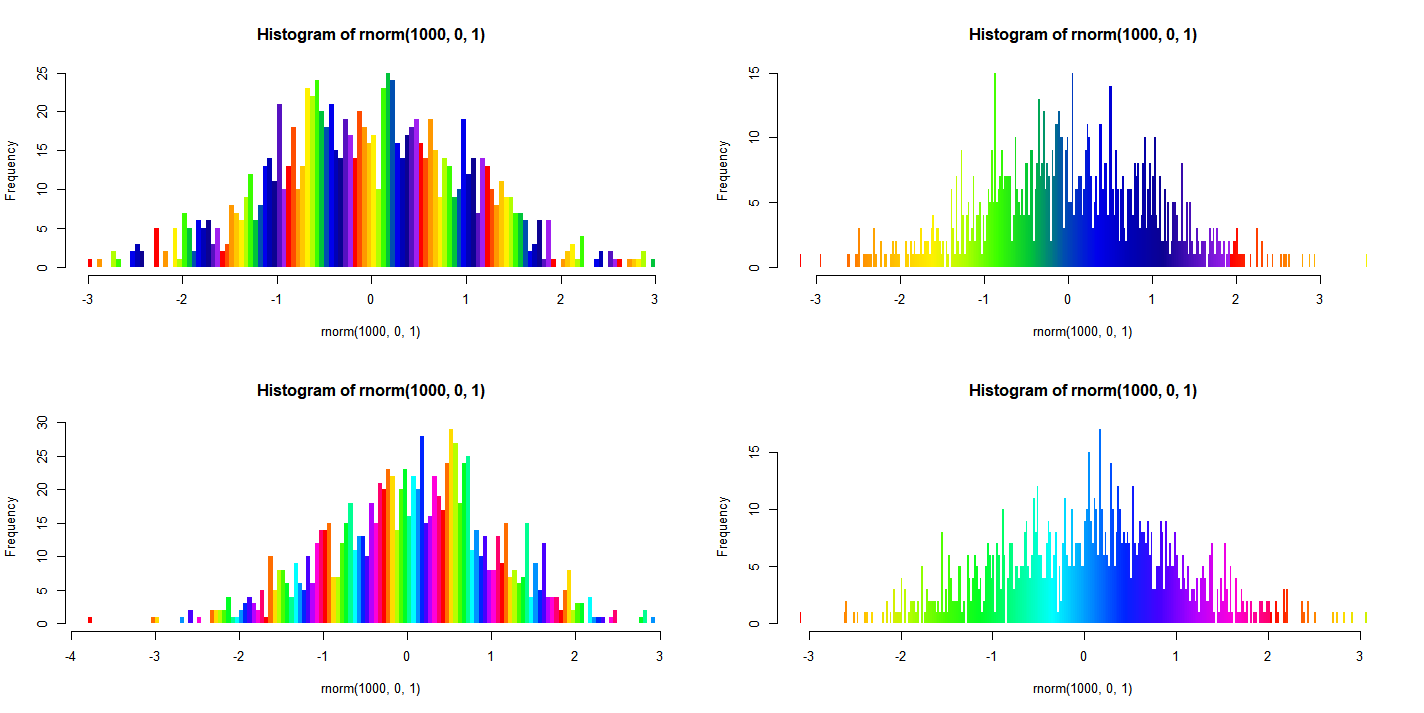
par(mfrow=c(2,2))

rainbowCol1 = colorRampPalette(c("red", "orange", "yellow", "green", "blue", "blue4", "purple"))(14)
rainbowCol1
hist(rnorm(1000, 0, 1), breaks=100, col=rainbowCol1, border=0)
colors=colorRampPalette(rainbowCol1)(256)
hist(rnorm(1000, 0, 1), breaks=256, col=colors, border=0)

rainbowCol2 = rainbow(14)
rainbowCol2
hist(rnorm(1000, 0, 1), breaks=100, col=rainbowCol2, border=0)
colors=colorRampPalette(rainbowCol2)(256)
hist(rnorm(1000, 0, 1), breaks=256, col=colors, border=0)


##############################################
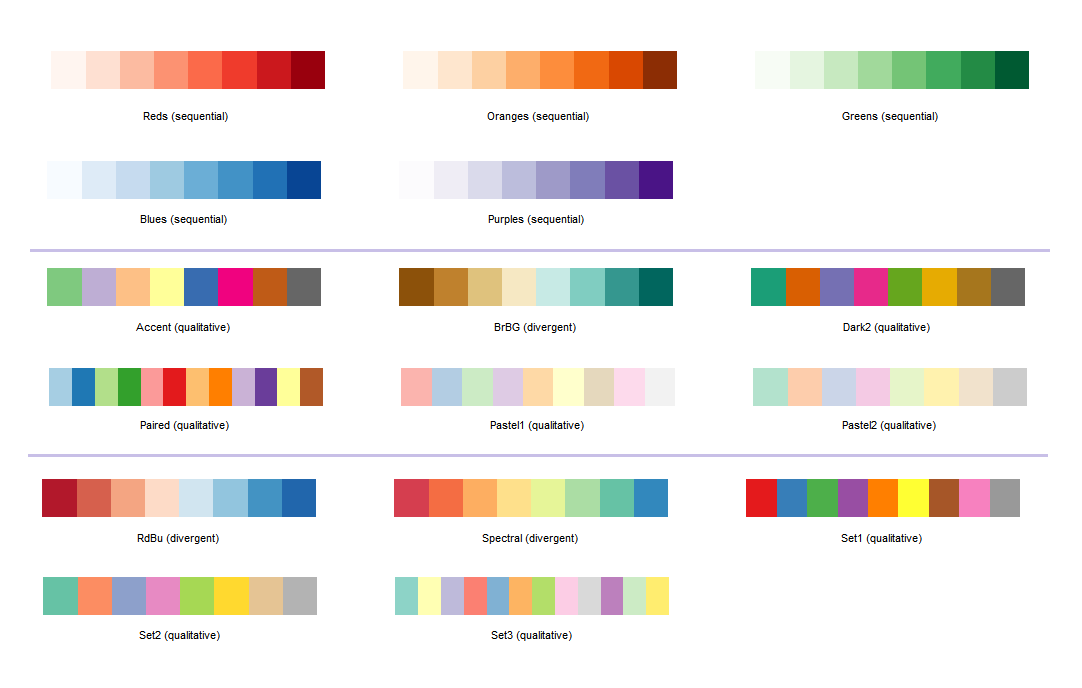
par(mfrow=c(2,3))
display.brewer.pal(n = 8, name = 'Reds')
display.brewer.pal(n = 8, name = 'Oranges')
display.brewer.pal(n = 8, name = 'Greens')
display.brewer.pal(n = 8, name = 'Blues')
display.brewer.pal(n = 8, name = 'Purples')

par(mfrow=c(2,3))
display.brewer.pal(n =  8, name = 'Accent')
display.brewer.pal(n =  8, name = 'BrBG')
display.brewer.pal(n =  8, name = 'Dark2')
display.brewer.pal(n = 12, name = 'Paired')
display.brewer.pal(n =  9, name = 'Pastel1')
display.brewer.pal(n =  8, name = 'Pastel2')

par(mfrow=c(2,3))
display.brewer.pal(n =  8, name = 'RdBu')
display.brewer.pal(n =  8, name = 'Spectral')
display.brewer.pal(n =  9, name = 'Set1')
display.brewer.pal(n =  8, name = 'Set2')
display.brewer.pal(n = 12, name = 'Set3')
|


