 1:
 2:
 3:
 4:
 5:
 6:
 7:
 8:
 9:
 10:
 11:
 12:
 13:
 14:
 15:
 16:
 17:
 18:
 19:
 20:
 21:
 22:
 23:
 24:
 25:
 26:
 27:
 28:
 29:
 30:
 31:
 32:
 33:
 34:
 35:
 36:
 37:
 38:
 39:
 40:
 41:
 42:
 43:
 44:
 45:
 46:
 47:
 48:
 49:
 50:
|
# Bar Plot ############################################################################
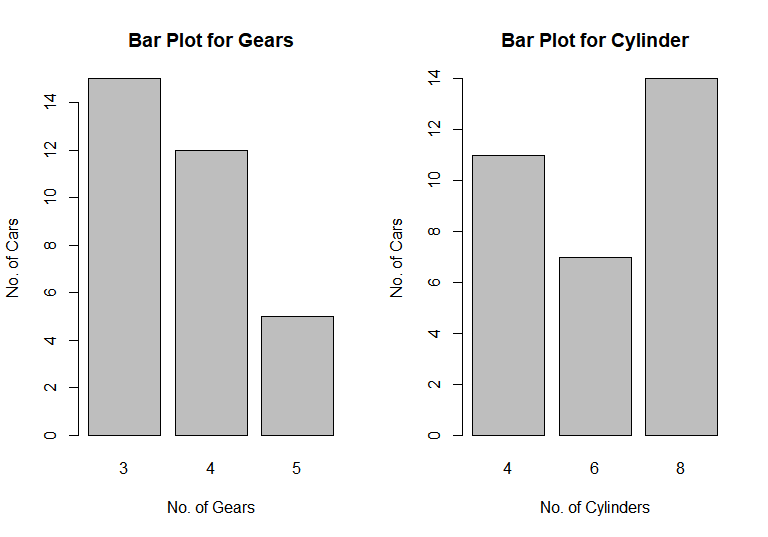
par(mfrow=c(1,2))
mtcars$gear
numCntGear = table(mtcars$gear)
numCntGear
class(numCntGear)
barplot(numCntGear, main="Bar Plot for Gears",
        xlab="No. of Gears", ylab="No. of Cars")
numCntCyl = table(mtcars$cyl)
barplot(numCntCyl, main="Bar Plot for Cylinder",
        xlab="No. of Cylinders", ylab="No. of Cars")


# Stacked/Grouped Bar Plot
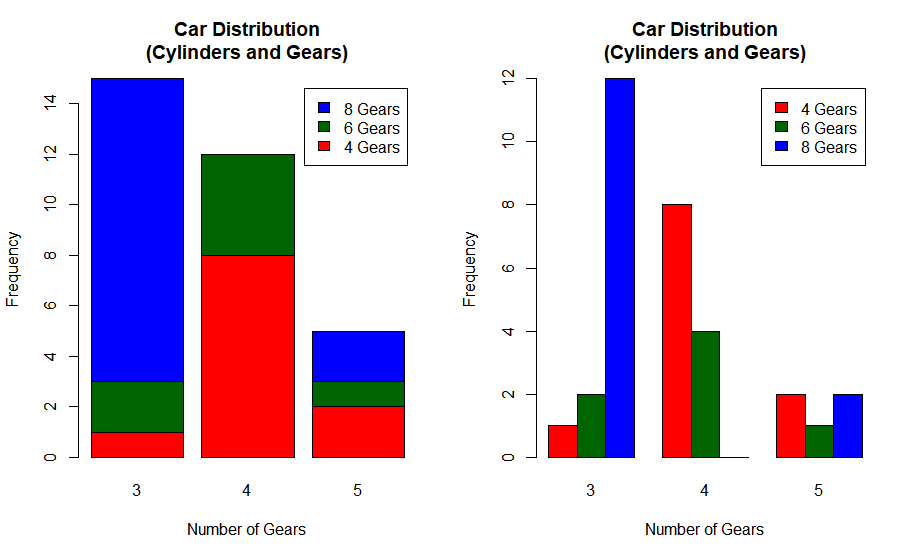
par(mfrow=c(1,2))
numCnt = table(mtcars$cyl, mtcars$gear)
numCnt

barplot(numCnt, main="Car Distribution\n(Cylinders and Gears)",
        xlab = "Number of Gears", col=c("red", "darkgreen", "blue"),
	ylab = "Frequency",
	legend = paste(rownames(numCnt), "Gears", sep=" "))

barplot(numCnt, main="Car Distribution\n(Cylinders and Gears)",
        xlab = "Number of Gears", col=c("red", "darkgreen", "blue"),
	ylab = "Frequency",
	legend = paste(rownames(numCnt), "Gears", sep=" "), beside=TRUE)


# Horizontal Bar Plot
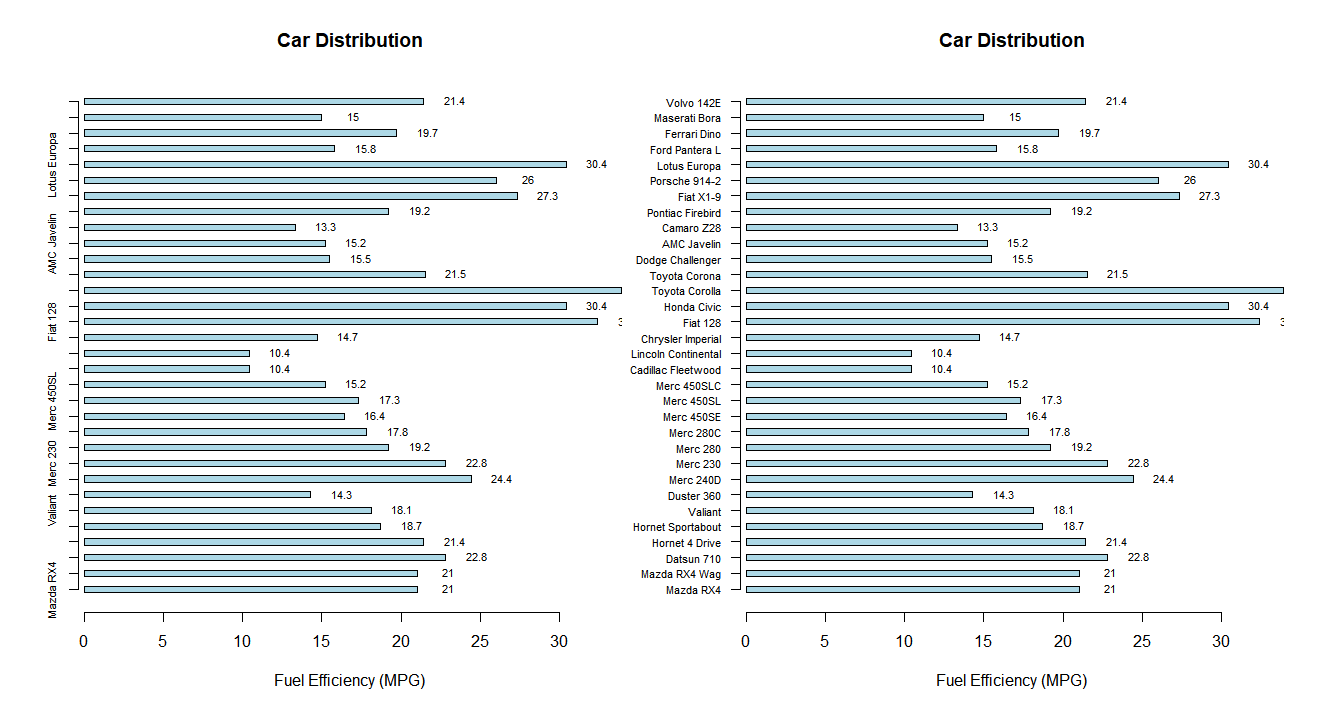
par(mfrow=c(1,2))
numMpg = mtcars$mpg

tableMpg = structure(numMpg, .Dim = length(numMpg),
                     .Dimnames = structure(list(row.names(mtcars)), .Names = ""),
		     class = "table")
tableMpg
objBarPlot = barplot(tableMpg, names.arg=row.names(mtcars),
                     horiz=TRUE, space=1.5, col="lightblue", cex.names=0.7,
		     main="Car Distribution",
		     xlab="Fuel Efficiency (MPG)", axis.lty = 1)
text(x = tableMpg+2, y = objBarPlot+0.2, labels=as.character(tableMpg), cex=0.7)
objBarPlot = barplot(tableMpg, names.arg=row.names(mtcars),
                     horiz=TRUE, space=1.5, col="lightblue", cex.names=0.7,
		     main="Car Distribution", las=1,
		     xlab="Fuel Efficiency (MPG)", axis.lty = 1)
text(x = tableMpg+2, y = objBarPlot+0.2, labels=as.character(tableMpg), cex=0.7)
|


