 1:
 2:
 3:
 4:
 5:
 6:
 7:
 8:
 9:
 10:
 11:
 12:
 13:
 14:
 15:
 16:
 17:
 18:
 19:
 20:
 21:
 22:
 23:
 24:
 25:
 26:
 27:
 28:
 29:
 30:
 31:
 32:
 33:
 34:
 35:
 36:
 37:
 38:
 39:
 40:
 41:
 42:
 43:
 44:
 45:
 46:
 47:
 48:
 49:
 50:
 51:
 52:
 53:
 54:
 55:
 56:
 57:
 58:
 59:
 60:
 61:
 62:
 63:
 64:
 65:
 66:
 67:
 68:
 69:
|
# Line Chart ####################################################################################################
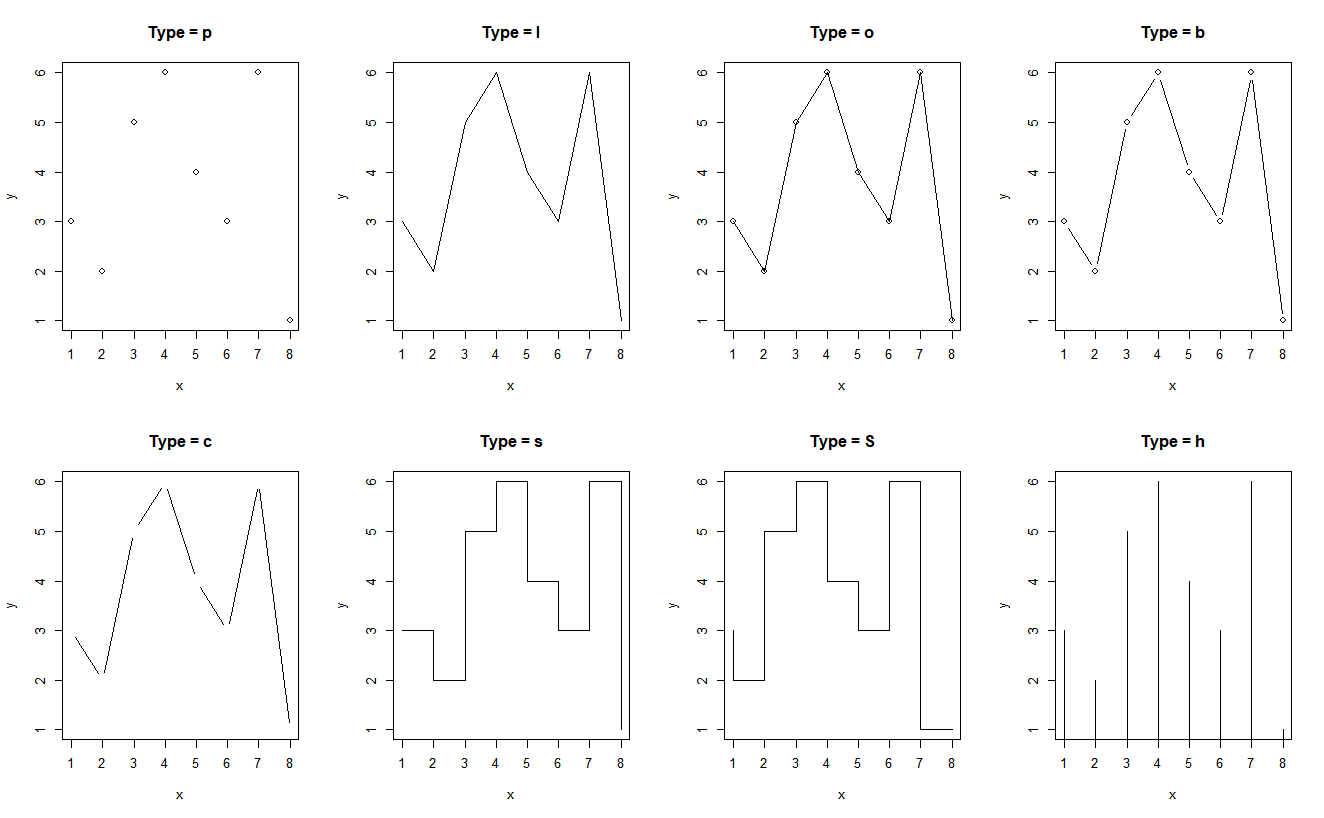
par(mfrow=c(2,4)) # all plots on one page
y = c(3, 2, 5, 6, 4, 3, 6, 1);
x = 1:length(y)

chrTypes = c("p","l","o","b","c","s","S","h")
for(i in 1:length(chrTypes)){
    par(pch=21, col="black", cex=0.8, bg="white")
    heading = paste("Type = ", chrTypes[i], sep="")
    plot(x, y, type="n", main=heading, bg="red")
    lines(x, y, type=chrTypes[i])
}

# https://stat.ethz.ch/R-manual/R-devel/library/graphics/html/plot.html
# "p" for points,
# "l" for lines,
# "b" for both,
# "c" for the lines part alone of "b",
# "o" for both overplotted,
# "h" for histogram like (or high-density) vertical lines,
# "s" for stair steps,
# "S" for other steps, see Details below,
# "n" for no plotting.


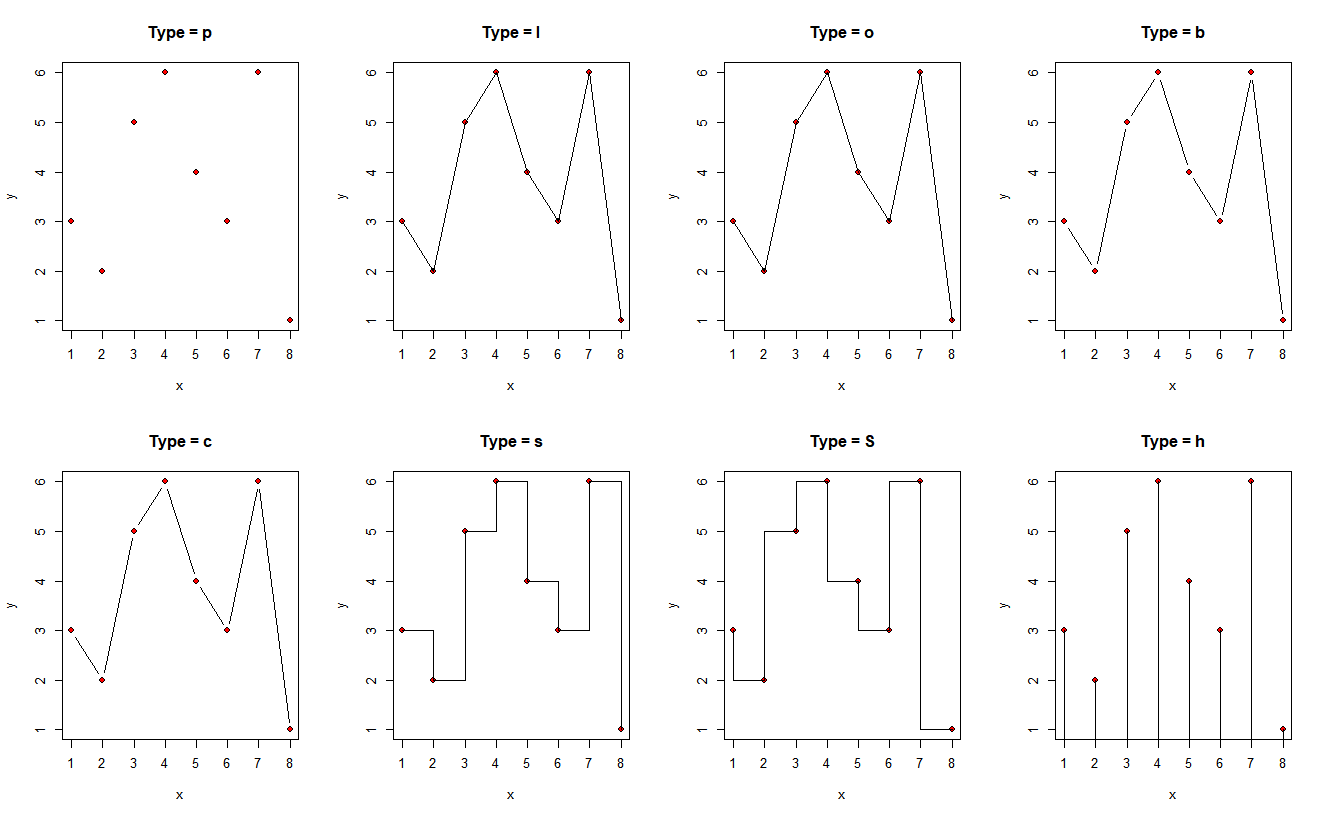
par(mfrow=c(2,4)) # all plots on one page
y = c(3, 2, 5, 6, 4, 3, 6, 1);
x = 1:length(y)

chrTypes = c("p","l","o","b","c","s","S","h")
for(i in 1:length(chrTypes)){
    par(pch=21, col="black", cex=0.8, bg="white")
    heading = paste("Type = ", chrTypes[i], sep="")
    plot(x, y, main=heading, bg="red")
    lines(x, y, type=chrTypes[i])
}


# Multiple Lines on the same plot area
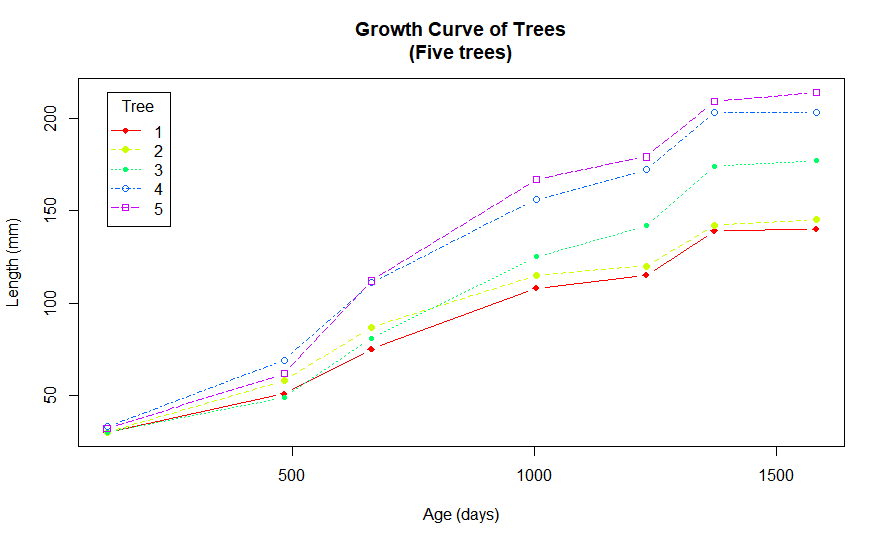
numTree = as.numeric(Orange$Tree)
numTreeCnt = max(numTree)
numAge = Orange$age
numLeng = Orange$circumference
dfTreeData = data.frame(numTree, numAge, numLeng)

colors = rainbow(numTreeCnt); colors
numLty = c(1:numTreeCnt); numLty
numPch = seq(18, 18+numTreeCnt, 1); numPch


# Drawing Plot Area
plot(range(numAge), range(numLeng), type="n",
     xlab="Age (days)", ylab="Length (mm)" )

# Drawing Individual Lines
for (i in 1:numTreeCnt) {
    dfCurTreeData = dfTreeData[numTree==i,]
    lines(dfCurTreeData$numAge, dfCurTreeData$numLeng, type="b", lwd=1.5,
    lty=numLty[i], col=colors[i], pch=numPch[i])
}

# Adding a title
title("Growth Curve of Trees\n(Five trees)")

# add a legend
legend(min(numAge), max(numLeng), 1:numTreeCnt, cex=1.0, col=colors,
  	pch=numPch, lty=numLty, title="Tree")
|


