 1:
 2:
 3:
 4:
 5:
 6:
 7:
 8:
 9:
 10:
 11:
 12:
 13:
 14:
 15:
 16:
 17:
 18:
 19:
 20:
 21:
 22:
 23:
 24:
 25:
 26:
 27:
 28:
 29:
 30:
 31:
 32:
 33:
 34:
 35:
 36:
 37:
 38:
 39:
 40:
 41:
|
# Pie Chart ########################################################################
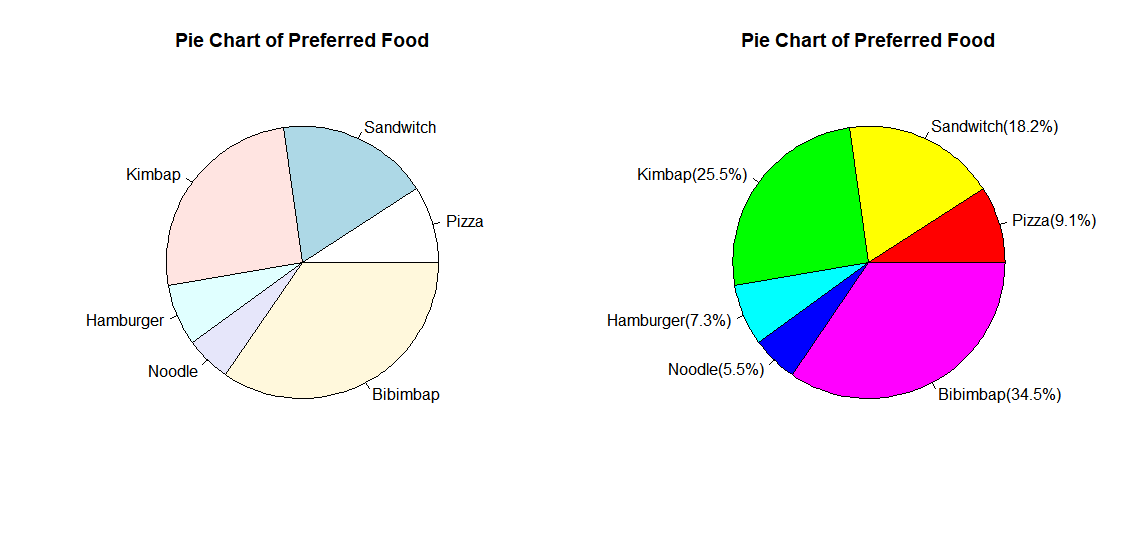
par(mfrow=c(1,2)) # all plots on one page
numFreq <- c(5, 10, 14, 4, 3, 19)
txtFood <- c("Pizza", "Sandwitch", "Kimbap", "Hamburger", "Noodle", "Bibimbap")
pie(numFreq, labels = txtFood, main="Pie Chart of Preferred Food")

#numPercent = round(numFreq/sum(numFreq)*100)
numPercent = numFreq/sum(numFreq)*100; numPercent
numPercent = sprintf("%0.1f", numPercent); numPercent
txtLabel <- paste(txtFood, "(", numPercent, "%)", sep=""); txtLabel
pie(numFreq, labels = txtLabel, col = rainbow(length(numFreq)),
    main="Pie Chart of Preferred Food")

# 3D Pie Chart
#install.packages("plotrix")
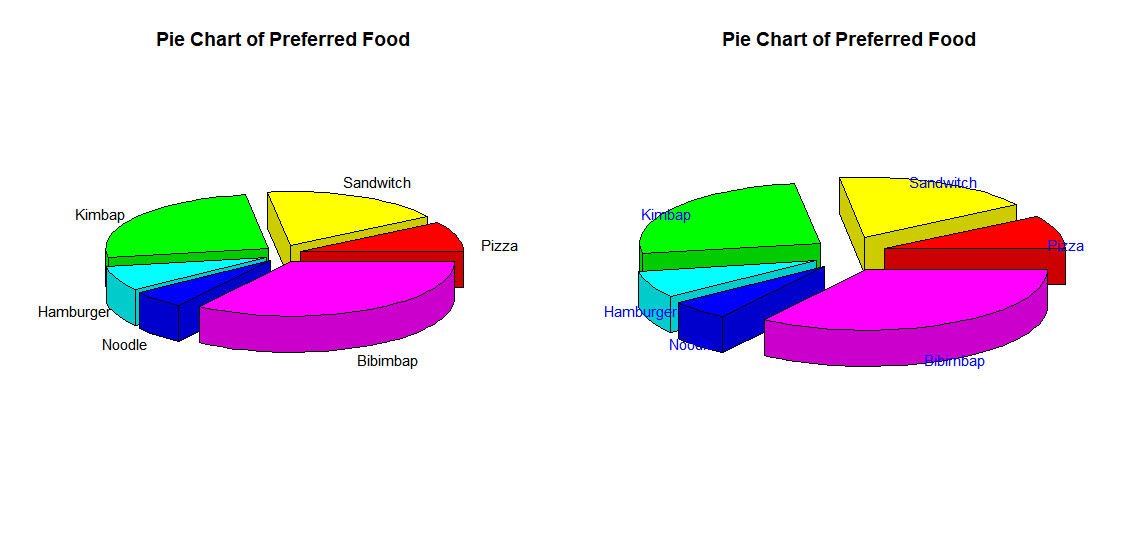
library(plotrix)
par(mfrow=c(1, 2))
numFreq <- c(5, 10, 14, 4, 3, 19)
txtFood <- c("Pizza", "Sandwitch", "Kimbap", "Hamburger", "Noodle", "Bibimbap")

pie3D(numFreq, labels = txtFood, explode = 0.1, radius = 0.9,
    main="Pie Chart of Preferred Food", labelcex=0.9)

pie3D(numFreq, labels = txtFood, explode = 0.2,
    main="Pie Chart of Preferred Food", labelcex=0.9, labelcol="blue")


# Pie Chart from data frame
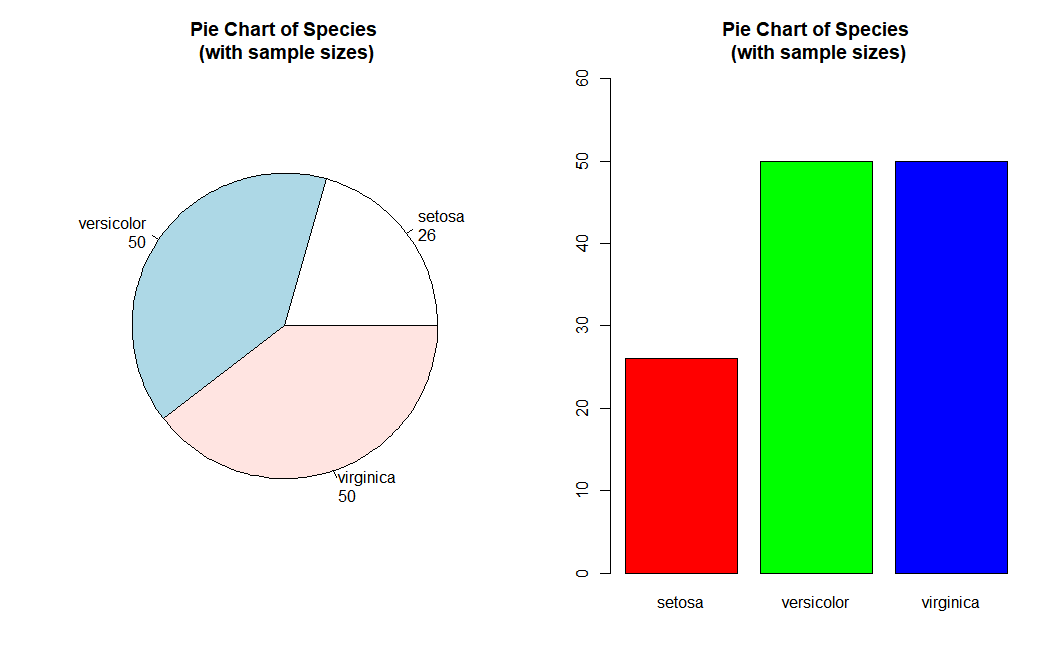
par(mfrow=c(1, 2))
head(iris)
dfSubset = iris[iris$Petal.Length > 1.4, ]
head(dfSubset)

tableSpec = table(dfSubset$Species); tableSpec
txtSpec = names(tableSpec); txtSpec
txtLabel = paste(txtSpec, "\n", tableSpec, sep=""); txtLabel

pie(tableSpec, labels = txtLabel,
  	main="Pie Chart of Species\n (with sample sizes)")
barplot(tableSpec, col=c("red", "green", "blue"), ylim=c(0,60),
  	main="Pie Chart of Species\n (with sample sizes)")
|


