 1:
 2:
 3:
 4:
 5:
 6:
 7:
 8:
 9:
 10:
 11:
 12:
 13:
 14:
 15:
 16:
 17:
 18:
 19:
 20:
 21:
 22:
 23:
 24:
 25:
 26:
 27:
 28:
 29:
 30:
 31:
 32:
 33:
 34:
 35:
 36:
 37:
 38:
 39:
 40:
 41:
 42:
 43:
 44:
 45:
|
# Boxplot ##################################################################
dfData = data.frame(mtcars$mpg, mtcars$cyl); head(dfData, n=10)
names(dfData) = c("numMpg", "numCyl"); head(dfData, n=10)

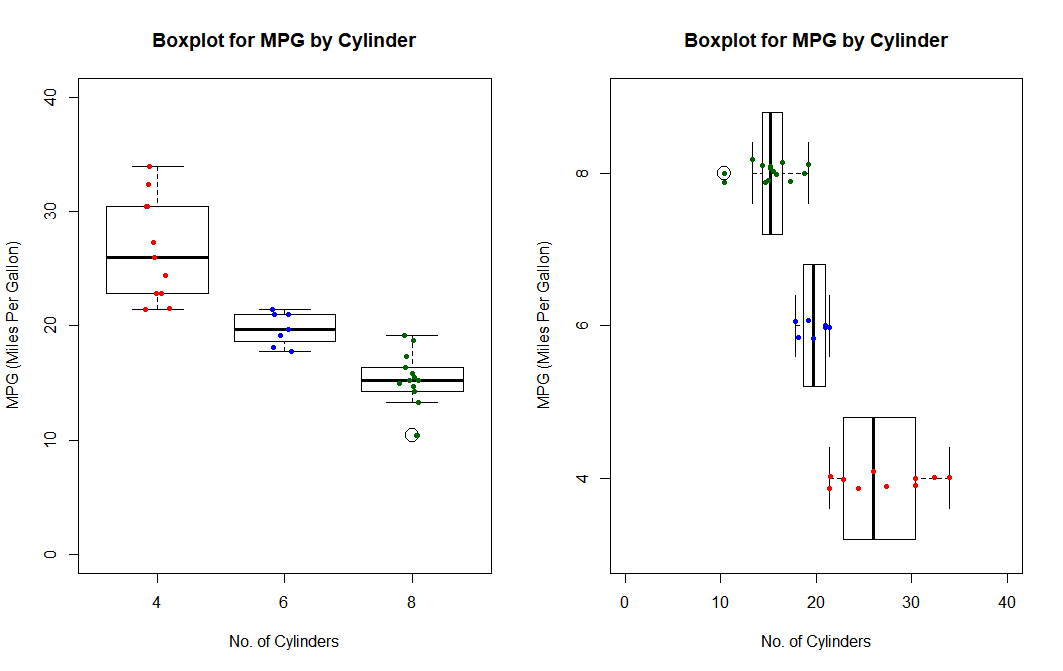
par(mfrow=c(1, 2))
boxplot(numMpg ~ numCyl, data = dfData, ylim=c(0, 40),
        main="Boxplot for MPG by Cylinder",
        xlab="No. of Cylinders", cex=2,
        ylab="MPG (Miles Per Gallon)")
stripchart(numMpg ~ numCyl, data = dfData, vertical = TRUE,
           method = "jitter", bg = c('red', 'blue', 'darkgreen'),
           pch = 20, cex = 1.0,
           col = c('red', 'blue', 'darkgreen'), add = TRUE);


boxplot(numMpg ~ numCyl, data = dfData, ylim=c(0, 40), horizontal = TRUE,
        main="Boxplot for MPG by Cylinder",
        xlab="No. of Cylinders", cex=2,
        ylab="MPG (Miles Per Gallon)")
stripchart(numMpg ~ numCyl, data = dfData, vertical = FALSE,
           method = "jitter", bg = c('red', 'blue', 'darkgreen'),
           pch = 20, cex = 1.0,
           col = c('red', 'blue', 'darkgreen'), add = TRUE);


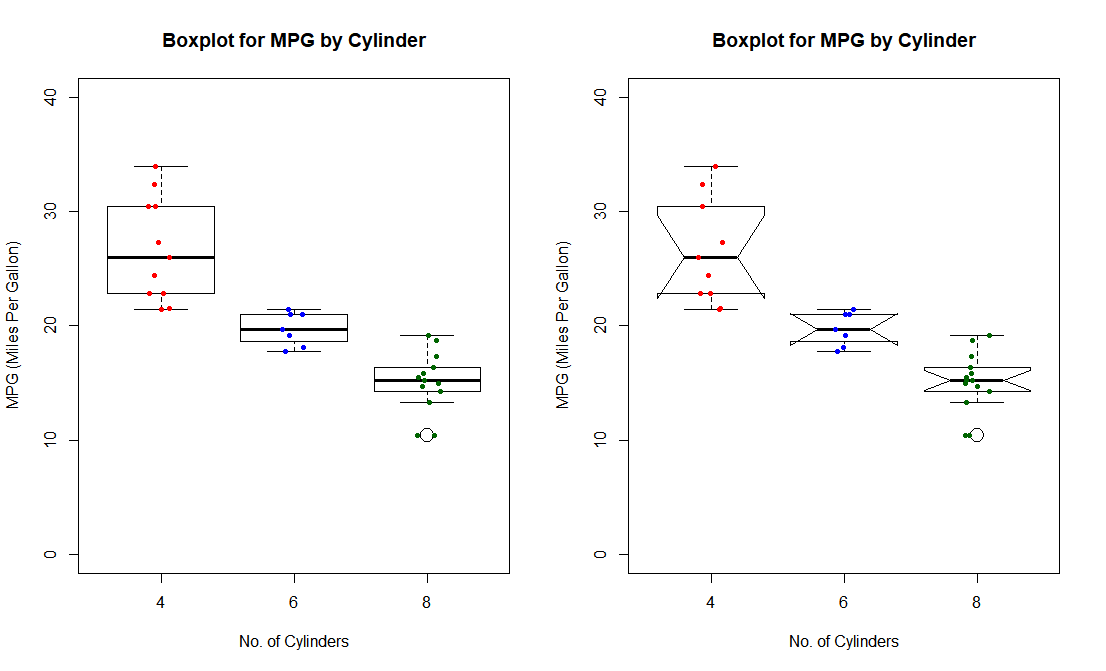
par(mfrow=c(1, 2))
boxplot(numMpg ~ numCyl, data = dfData, ylim=c(0, 40),
        main="Boxplot for MPG by Cylinder",
        xlab="No. of Cylinders", cex=2,
        ylab="MPG (Miles Per Gallon)")
stripchart(numMpg ~ numCyl, data = dfData, vertical = TRUE,
           method = "jitter", bg = c('red', 'blue', 'darkgreen'),
           pch = 20, cex = 1.0,
           col = c('red', 'blue', 'darkgreen'), add = TRUE);

dfData = data.frame(mtcars$mpg, mtcars$cyl); head(dfData, n=10)
names(dfData) = c("numMpg", "numCyl"); head(dfData, n=10)
boxplot(numMpg ~ numCyl, data = dfData, notch=TRUE,
        main="Boxplot for MPG by Cylinder",
        xlab="No. of Cylinders", cex=2, ylim=c(0, 40),
        ylab="MPG (Miles Per Gallon)")
stripchart(numMpg ~ numCyl, data = dfData, vertical = TRUE,
           method = "jitter", bg = c('red', 'blue', 'darkgreen'),
           pch = 20, cex = 1.0,
           col = c('red', 'blue', 'darkgreen'), add = TRUE);
|

