 1:
 2:
 3:
 4:
 5:
 6:
 7:
 8:
 9:
 10:
 11:
 12:
 13:
 14:
 15:
 16:
 17:
 18:
 19:
 20:
 21:
 22:
 23:
 24:
 25:
 26:
 27:
 28:
 29:
 30:
 31:
 32:
 33:
 34:
 35:
 36:
 37:
 38:
 39:
 40:
 41:
 42:
 43:
 44:
 45:
 46:
 47:
|
# Correlation Matrix
# install.packages("ellipse")
library(ellipse)
library(RColorBrewer)

# Data
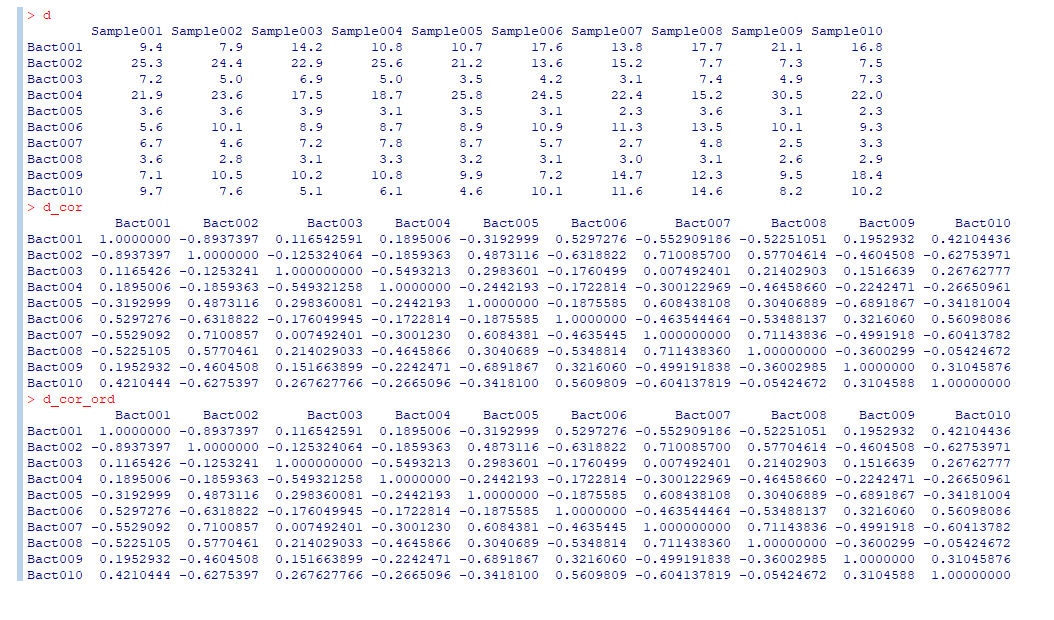
d = read.table(header = TRUE, text =
"Sample001 Sample002 Sample003 Sample004 Sample005 Sample006 Sample007 Sample008 Sample009 Sample010
Bact006 5.6  10.1  8.9  8.7  8.9  10.9  11.3  13.5  10.1  9.3
Bact007 6.7  4.6  7.2  7.8  8.7  5.7  2.7  4.8  2.5  3.3
Bact002 25.3  24.4  22.9  25.6  21.2  13.6  15.2  7.7  7.3  7.5
Bact003 7.2  5.0  6.9  5.0  3.5  4.2  3.1  7.4  4.9  7.3
Bact001 9.4  7.9  14.2  10.8  10.7  17.6  13.8  17.7  21.1  16.8
Bact008 3.6  2.8  3.1  3.3  3.2  3.1  3.0  3.1  2.6  2.9
Bact004 21.9  23.6  17.5  18.7  25.8  24.5  22.4  15.2  30.5  22.0
Bact005 3.6  3.6  3.9  3.1  3.5  3.1  2.3  3.6  3.1  2.3
Bact009 7.1  10.5  10.2  10.8  9.9  7.2  14.7  12.3  9.5  18.4
Bact010 9.7  7.6  5.1  6.1  4.6  10.1  11.6  14.6  8.2  10.2
")

# Make a correlation table
d_cor = cor(t(d))


# Re-orering parameters
names = rownames(d)
ord = order(names)
d_cor_ord = d_cor[ord, ord]

# Preparing colors and drawing
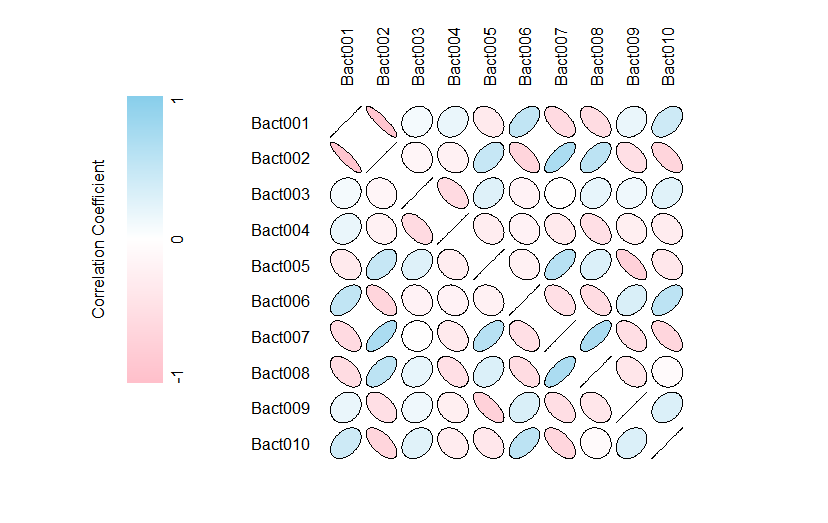
layout(matrix(c(1,2),nrow=1), width=c(3,10))
colors    = colorRampPalette(c("pink","white","skyblue"))(100);
colors256 = colorRampPalette(c("pink","white","skyblue"))(256);

# 1st Area: Left Top
par(mar=c(10,2,10,2))
plot(NA, xlim=c(0, 4), ylim=c(-1, 1), axes=F, ann=F, yaxs="i")
bY = seq(-1, 1, length = 256);
rect(2, bY[1:256], 4, bY[2:257], col=colors256, border=NA)
mtext("-1", side=4, line=0, adj=0, cex=1)
mtext("1",  side=4, line=0, adj=1, cex=1)
mtext("0",  side=4, line=0, cex=1)
text(0.3, 0, "Correlation Coefficient", cex=1, srt=90)

# 2nd Area: Right Bottom
par(mar=c(0,0,0,0))
plotcorr(d_cor_ord, col=colors[d_cor_ord*50+50], mar=c(1,1,1,1))
|

