 1:
 2:
 3:
 4:
 5:
 6:
 7:
 8:
 9:
 10:
 11:
 12:
 13:
 14:
 15:
 16:
 17:
 18:
 19:
 20:
 21:
 22:
 23:
 24:
 25:
 26:
 27:
 28:
 29:
 30:
 31:
 32:
 33:
 34:
 35:
 36:
 37:
 38:
 39:
 40:
 41:
 42:
 43:
 44:
 45:
 46:
 47:
 48:
 49:
 50:
|
############################################################
# Data
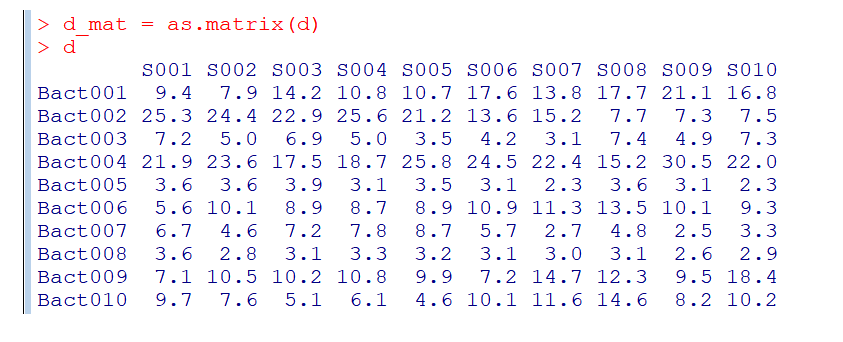
d = read.table(header = TRUE, text =
"S001 S002 S003 S004 S005 S006 S007 S008 S009 S010
Bact001 9.4  7.9  14.2  10.8  10.7  17.6  13.8  17.7  21.1  16.8
Bact002 25.3  24.4  22.9  25.6  21.2  13.6  15.2  7.7  7.3  7.5
Bact003 7.2  5.0  6.9  5.0  3.5  4.2  3.1  7.4  4.9  7.3
Bact004 21.9  23.6  17.5  18.7  25.8  24.5  22.4  15.2  30.5  22.0
Bact005 3.6  3.6  3.9  3.1  3.5  3.1  2.3  3.6  3.1  2.3
Bact006 5.6  10.1  8.9  8.7  8.9  10.9  11.3  13.5  10.1  9.3
Bact007 6.7  4.6  7.2  7.8  8.7  5.7  2.7  4.8  2.5  3.3
Bact008 3.6  2.8  3.1  3.3  3.2  3.1  3.0  3.1  2.6  2.9
Bact009 7.1  10.5  10.2  10.8  9.9  7.2  14.7  12.3  9.5  18.4
Bact010 9.7  7.6  5.1  6.1  4.6  10.1  11.6  14.6  8.2  10.2
")

d_mat = as.matrix(d)
d

############################################################
# Scaling
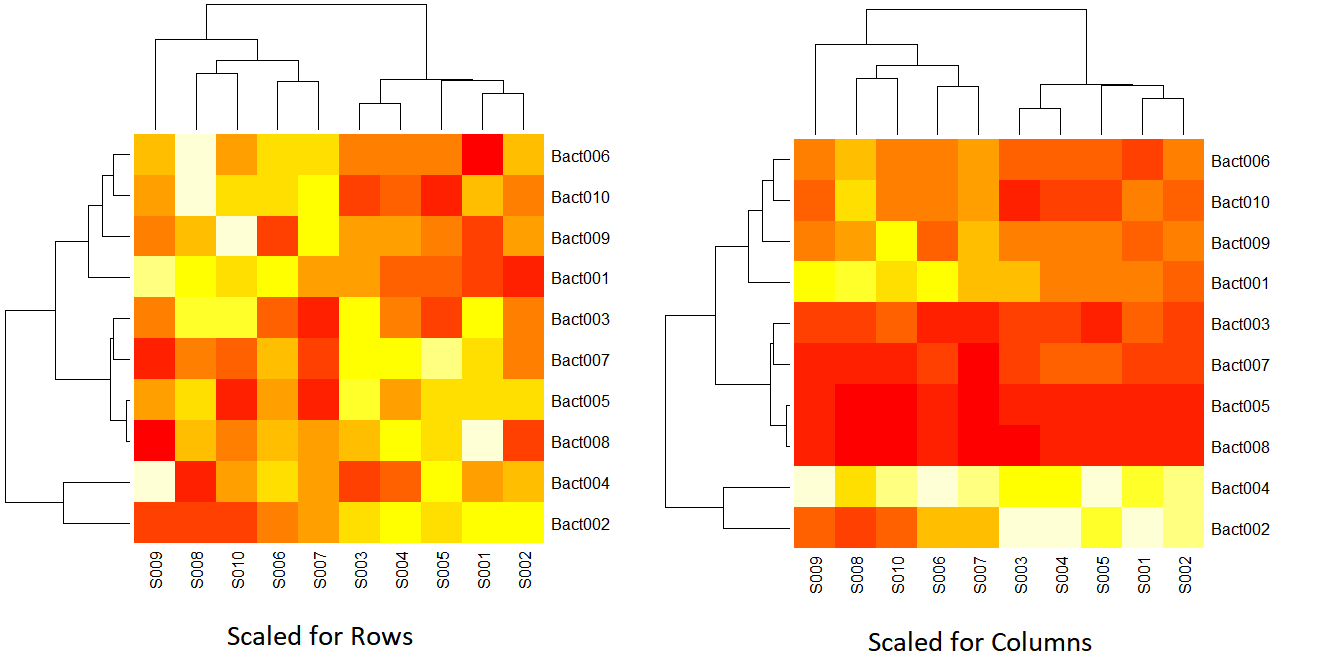
heatmap(d_mat, margins = c(8, 8)) # scaled for rows
heatmap(d_mat, margins = c(8, 8), scale="column")

############################################################
# Remove a Dendrogram
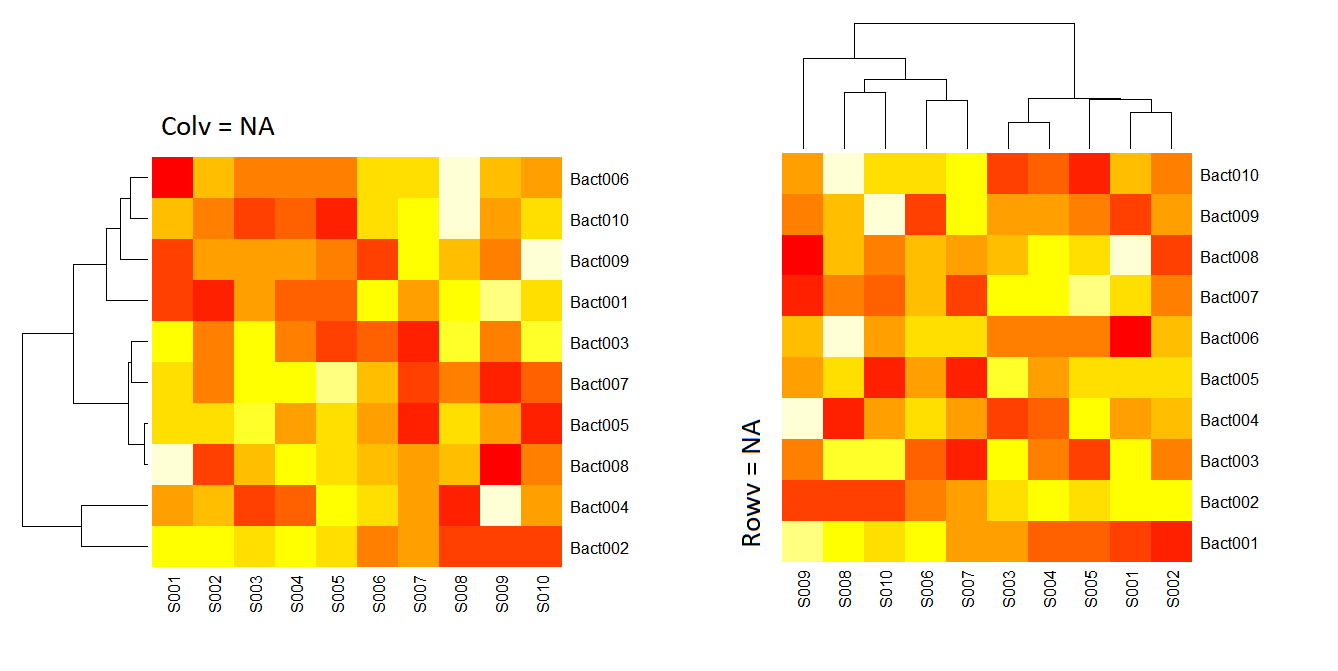
heatmap(d_mat, margins = c(8, 8), Colv = NA)
heatmap(d_mat, margins = c(8, 8), Rowv = NA)

############################################################
# Colors
library(RColorBrewer)
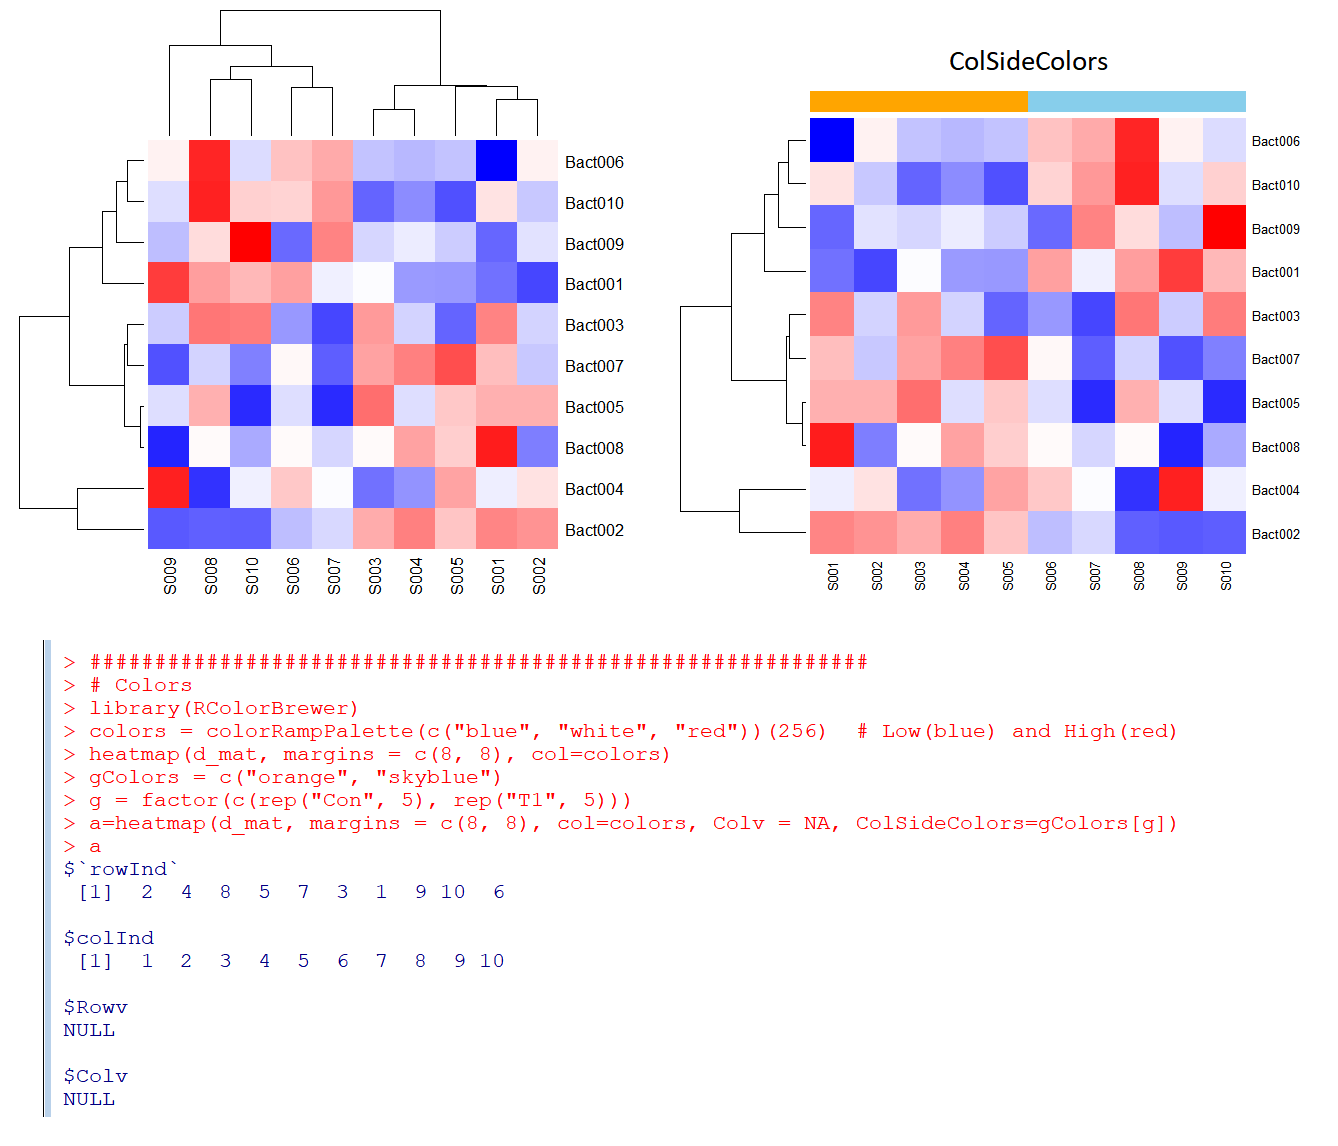
colors = colorRampPalette(c("blue", "white", "red"))(256)  # Low(blue) and High(red)
heatmap(d_mat, margins = c(8, 8), col=colors)
gColors = c("orange", "skyblue")
g = factor(c(rep("Con", 5), rep("T1", 5)))
a=heatmap(d_mat, margins = c(8, 8), col=colors, Colv = NA, ColSideColors=gColors[g])
a

############################################################
# Heatmap.2
# install.packages("gplots")
library(gplots)
colors = colorRampPalette(c("blue", "white", "red"))(256)  # Low(blue) and High(red)
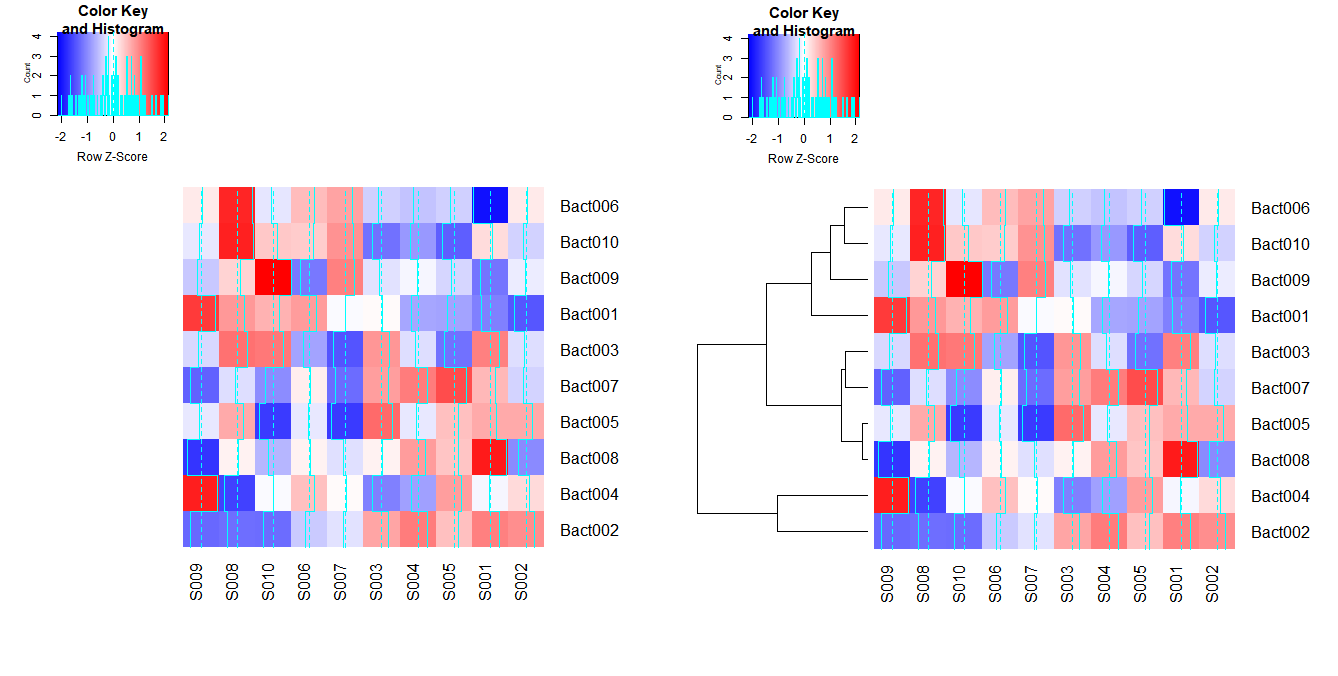
heatmap.2(d_mat, margins = c(8, 8), dendrogram="none", scale="row", col=colors)
heatmap.2(d_mat, margins = c(8, 8), dendrogram="row", scale="row", col=colors)

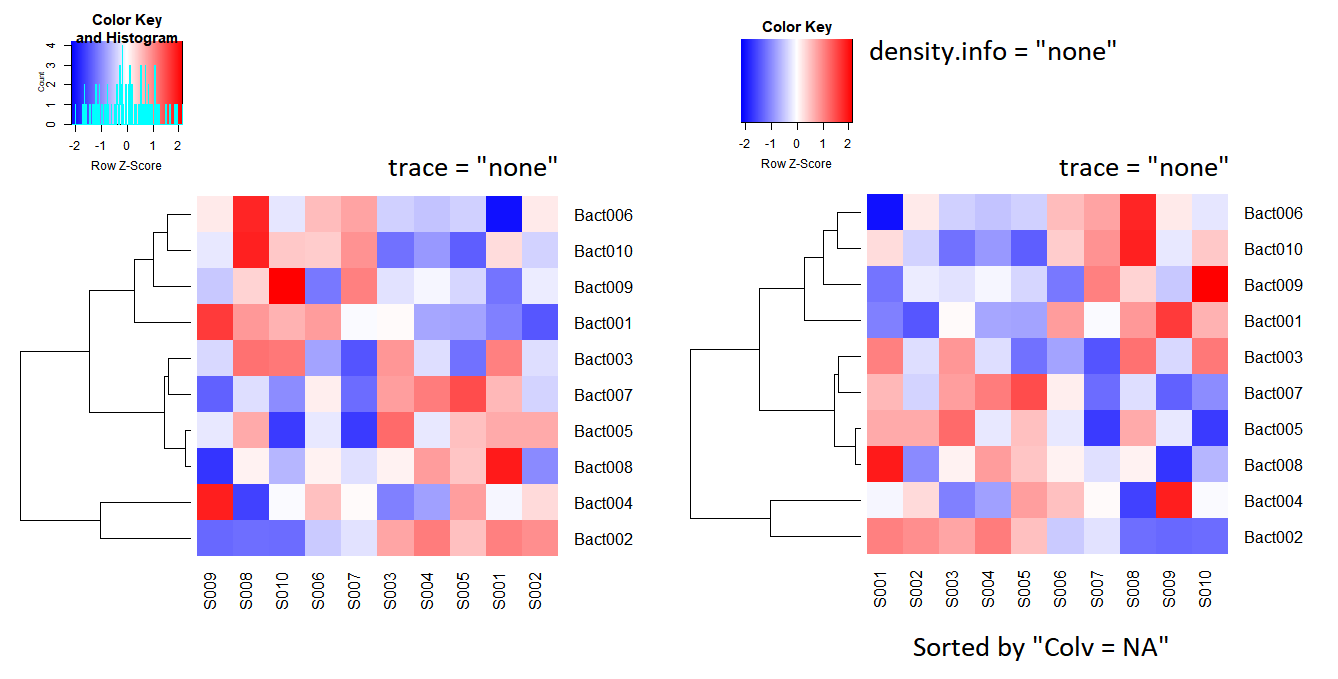
heatmap.2(d_mat, margins = c(8, 8), dendrogram="row", scale="row", col=colors, trace = "none")
heatmap.2(d_mat, margins = c(8, 8), dendrogram="row", scale="row", col=colors, trace = "none", density.info = "none", Colv = NA)
|
