 1:
 2:
 3:
 4:
 5:
 6:
 7:
 8:
 9:
 10:
 11:
 12:
 13:
 14:
 15:
 16:
 17:
 18:
 19:
 20:
 21:
 22:
 23:
 24:
 25:
 26:
 27:
 28:
 29:
 30:
 31:
 32:
 33:
 34:
 35:
 36:
 37:
 38:
 39:
 40:
 41:
 42:
 43:
 44:
 45:
 46:
 47:
 48:
 49:
 50:
 51:
 52:
 53:
 54:
 55:
 56:
 57:
 58:
 59:
 60:
 61:
 62:
 63:
 64:
 65:
 66:
 67:
 68:
 69:
 70:
 71:
 72:
 73:
 74:
 75:
 76:
 77:
 78:
 79:
 80:
 81:
 82:
 83:
 84:
|
############################################################
# Data
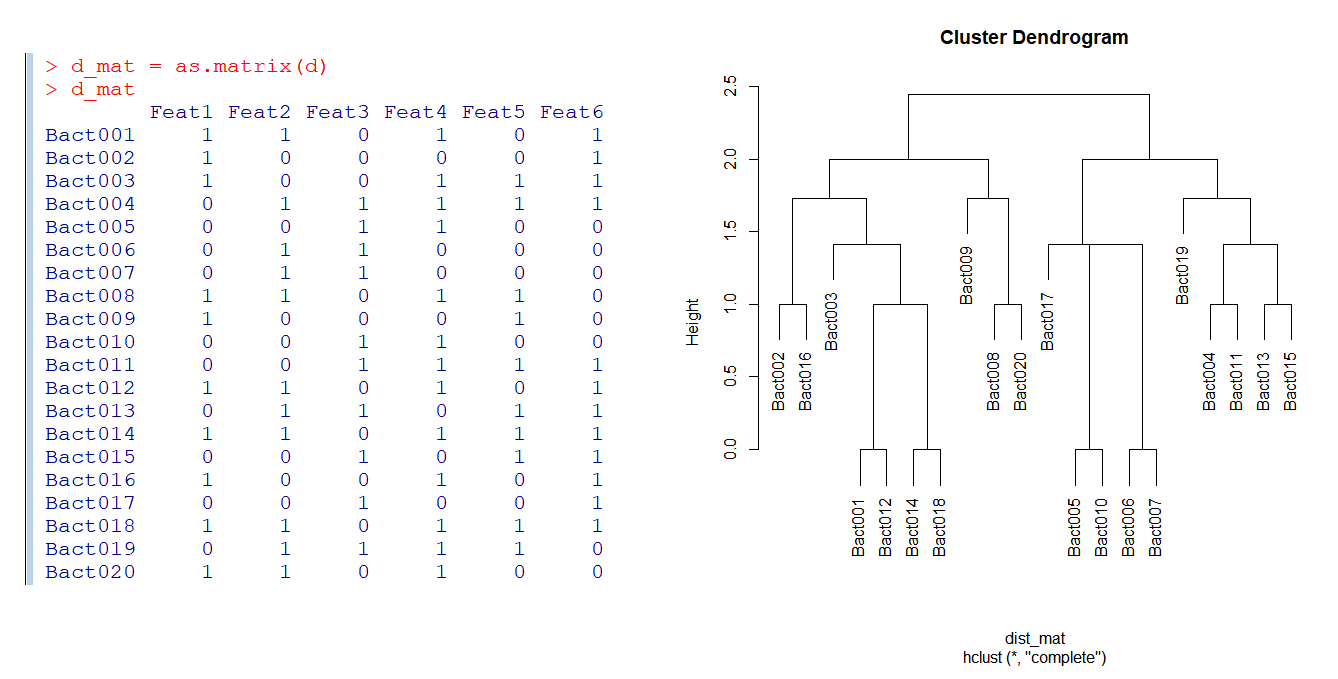
d = read.table(header = TRUE, text =
"Feat1 Feat2 Feat3 Feat4 Feat5 Feat6
Bact001 1 1 0 1 0 1
Bact002 1 0 0 0 0 1
Bact003 1 0 0 1 1 1
Bact004 0 1 1 1 1 1
Bact005 0 0 1 1 0 0
Bact006 0 1 1 0 0 0
Bact007 0 1 1 0 0 0
Bact008 1 1 0 1 1 0
Bact009 1 0 0 0 1 0
Bact010 0 0 1 1 0 0
Bact011 0 0 1 1 1 1
Bact012 1 1 0 1 0 1
Bact013 0 1 1 0 1 1
Bact014 1 1 0 1 1 1
Bact015 0 0 1 0 1 1
Bact016 1 0 0 1 0 1
Bact017 0 0 1 0 0 1
Bact018 1 1 0 1 1 1
Bact019 0 1 1 1 1 0
Bact020 1 1 0 1 0 0
")

d_mat = as.matrix(d)
d_mat

############################################################
# Simple Dendrogram
dist_mat   = dist(d_mat, method="euclidean")      # distance matrix (diagonal)
dist_mat
dist_clust = hclust(dist_mat)                     # clustering based on distance
dist_clust
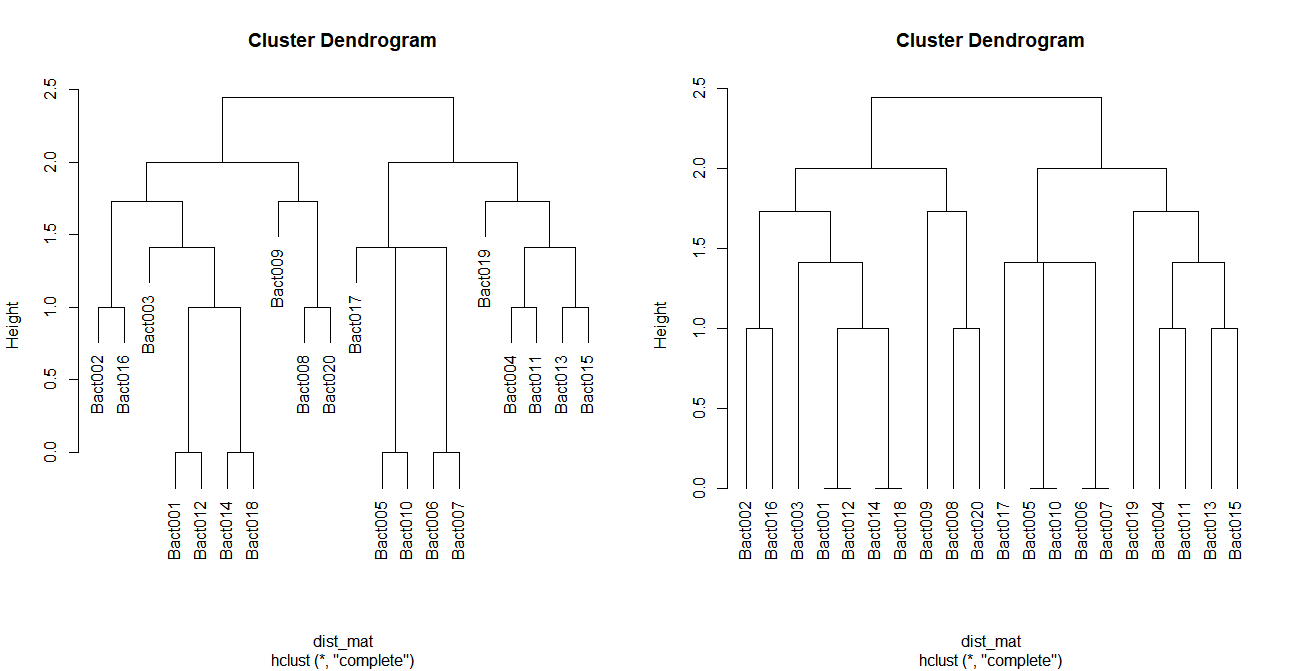
par(mfrow=c(1, 2))
plot(dist_clust, cex = 1)
plot(dist_clust, cex = 1, hang = -1)

############################################################
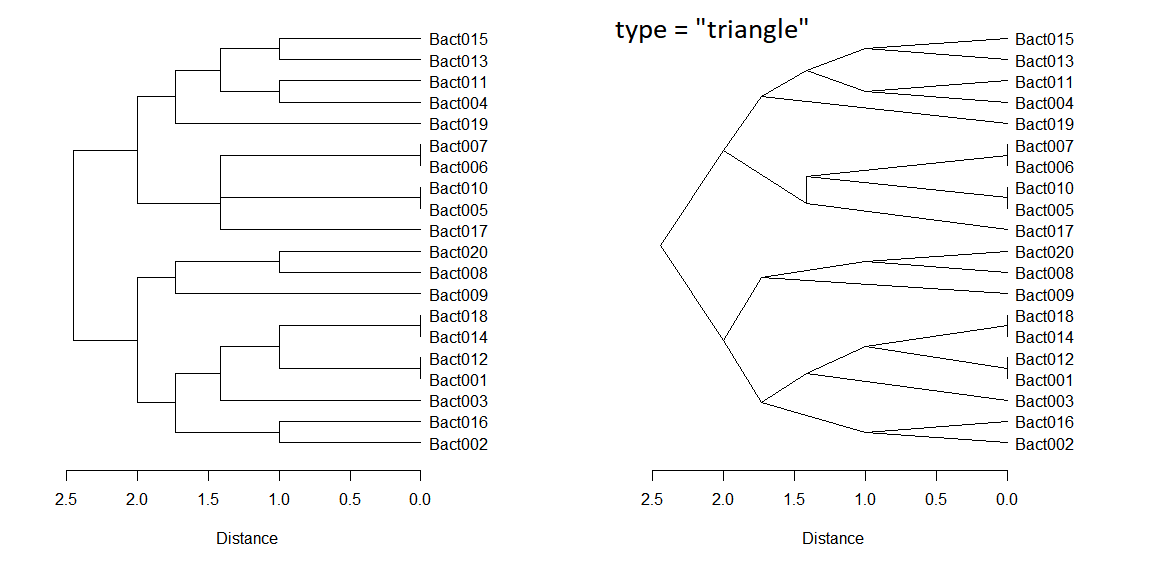
par(mfrow=c(1, 2)); par(mar=c(8, 3, 3, 8))
dend = as.dendrogram(dist_clust)
plot(dend, cex = 1, horiz = TRUE, xlab="Distance")
plot(dend, cex = 1, horiz = TRUE, xlab="Distance", type = "triangle")

############################################################
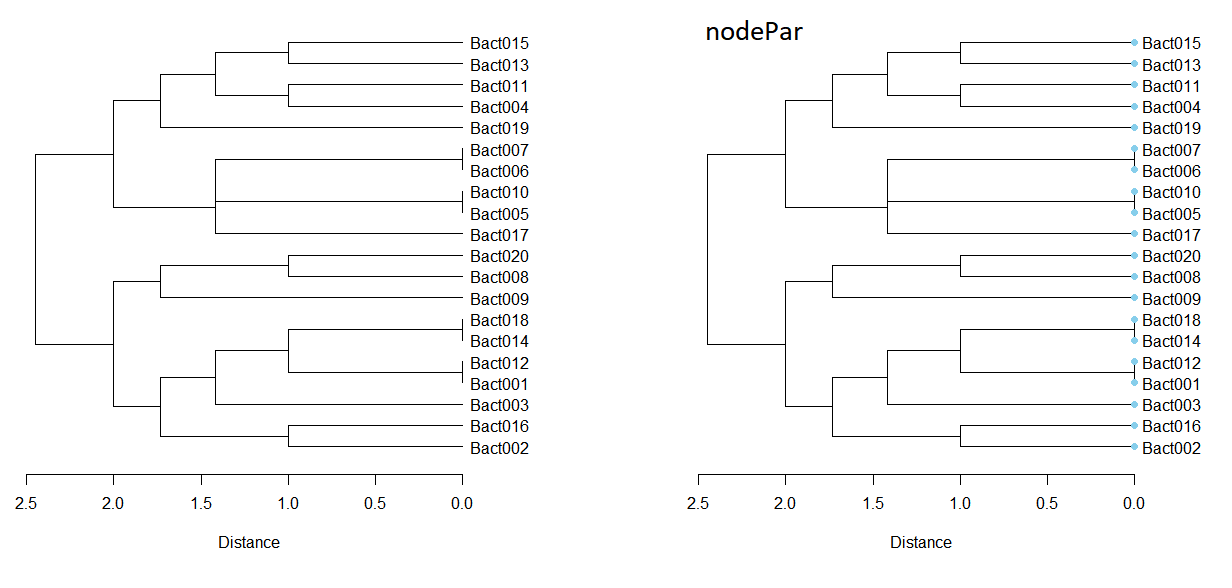
par(mfrow=c(1, 2)); par(mar=c(8, 3, 3, 8))
plot(dend, cex = 1, horiz = TRUE, xlab="Distance")
nodeSet = list(lab.cex = 1.0, pch = c(NA, 19), cex = 1.0, col = "skyblue")
plot(dend, cex = 1, horiz = TRUE, xlab="Distance", nodePar = nodeSet)


############################################################
# From dendrogram to phylogenetic tree
# install.packages("ape")
library("ape")

tree = as.phylo(dist_clust)
tree$edge.length
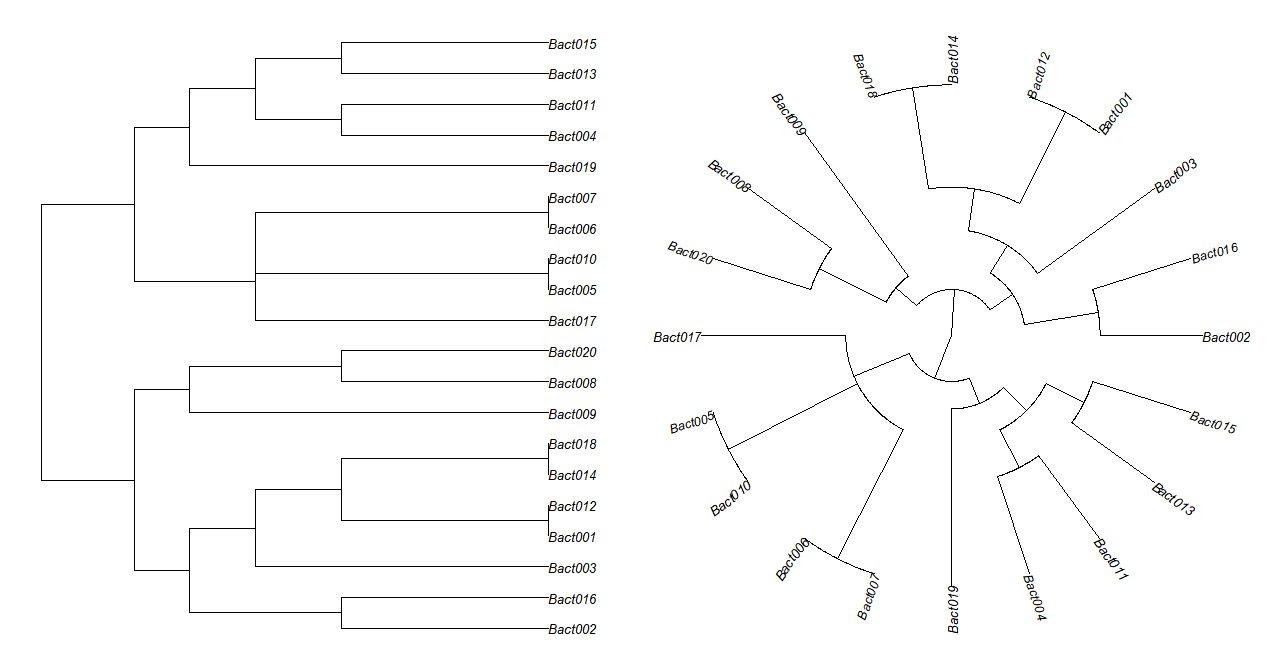
par(mfrow=c(1, 2)); par(mar=c(1,1,1,1))
# "phylogram", "cladogram", "fan", "unrooted", "radial"
plot(tree, cex=0.8, type = "phylogram")
plot(tree, cex=0.8, type = "fan")

############################################################
lab=tree$tip.label
lab
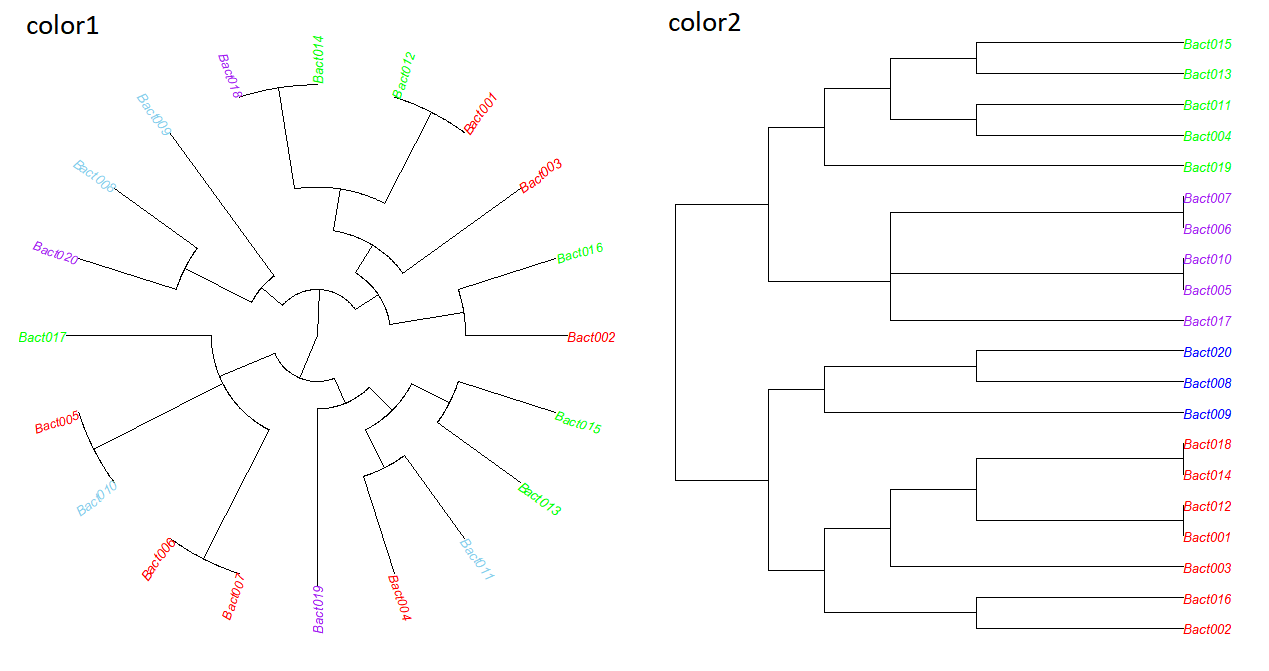
color1 = c("red", "red", "red", "red", "red", "red", "red",
           "skyblue", "skyblue", "skyblue", "skyblue",
           "green", "green", "green", "green", "green", "green",
           "purple", "purple", "purple")
color2 = c("red", "red", "red", "green", "purple", "purple", "purple",
           "blue", "blue", "purple", "green", "red", "green", "red",
		   "green", "red", "purple", "red", "green", "blue")
cbind(lab, color1)
cbind(lab, color2)
plot(tree, cex=0.8, tip.color=color1, type = "fan")
plot(tree, cex=0.8, tip.color=color2)


# For more information
http://www.sthda.com/english/wiki/beautiful-dendrogram-visualizations-in-r-5-must-known-methods-unsupervised-machine-learning
http://www.r-graph-gallery.com/31-custom-colors-in-dendrogram/
|
