 1:
 2:
 3:
 4:
 5:
 6:
 7:
 8:
 9:
 10:
 11:
 12:
 13:
 14:
 15:
 16:
 17:
 18:
 19:
 20:
 21:
 22:
 23:
 24:
 25:
 26:
 27:
 28:
 29:
 30:
 31:
 32:
 33:
 34:
 35:
 36:
 37:
 38:
 39:
 40:
 41:
 42:
 43:
 44:
 45:
 46:
 47:
 48:
|
############################################################
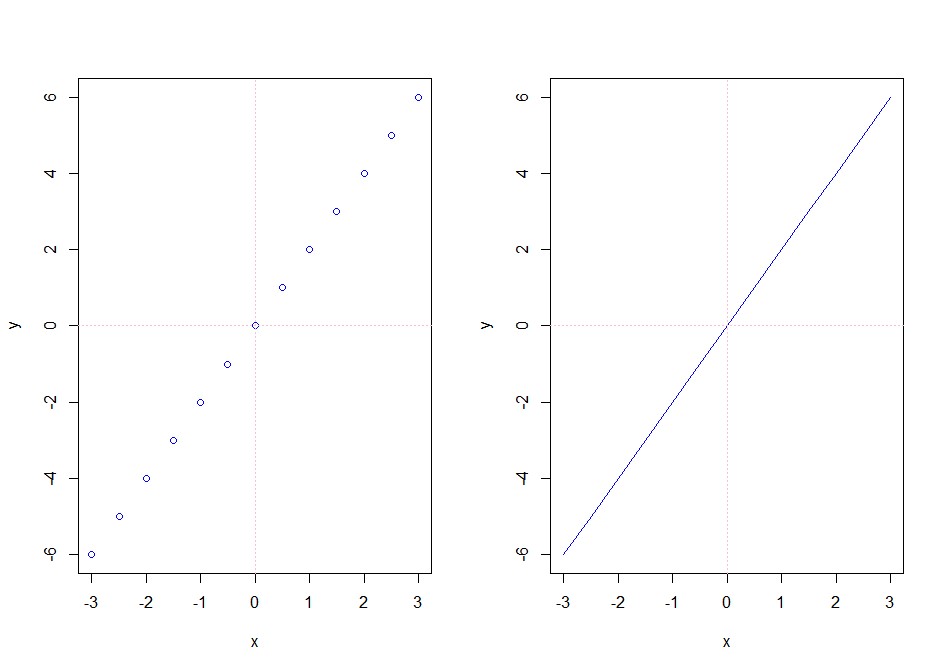
# Line Function to Graph - X from seq function
############################################################
par( mfrow = c( 1, 2 ) )        # 2 rows and 1 col
x = seq(-3, 3, 0.5)
y= 2* x
plot(x, y, cex=1, col="blue");            abline(v=0, col="pink", lty=21); abline(h=0, col="pink", lty=21)
plot(x, y, cex=1, col="blue", type="l");  abline(v=0, col="pink", lty=21); abline(h=0, col="pink", lty=21)


############################################################
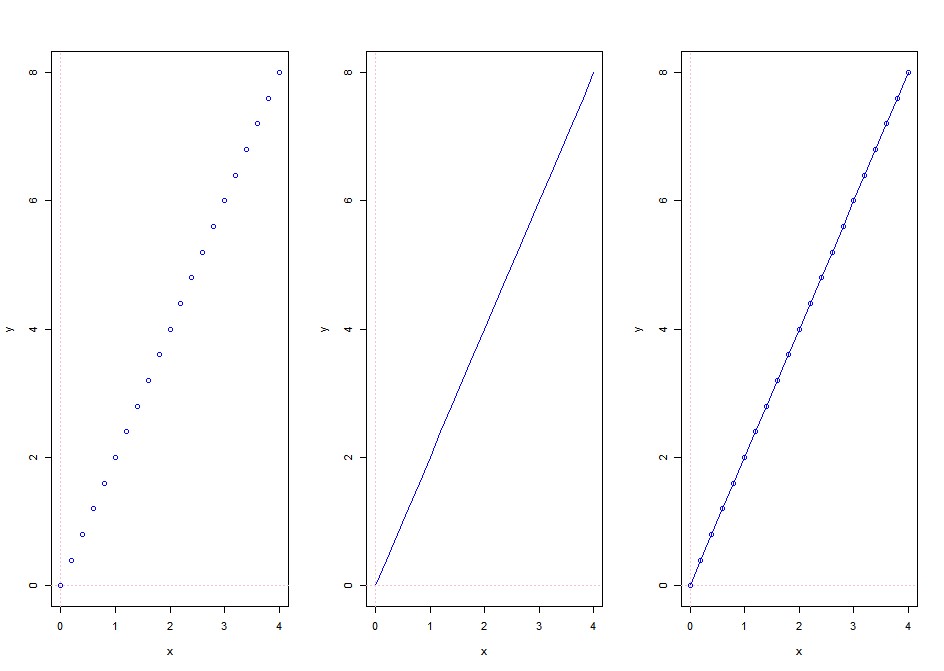
# Line Function to Graph - X from 0:20
############################################################
par( mfrow = c( 1, 3 ) )        # 2 rows and 1 col
x=0:20; x=x/5
y= 2* x
plot(x, y, cex=1, col="blue");            abline(v=0, col="pink", lty=21); abline(h=0, col="pink", lty=21)
plot(x, y, cex=1, col="blue", type="l");  abline(v=0, col="pink", lty=21); abline(h=0, col="pink", lty=21)
plot(x, y, cex=1, col="blue", type="o");  abline(v=0, col="pink", lty=21); abline(h=0, col="pink", lty=21)
# p - points / l - lines / b - both points and lines / c - empty points joined by lines
# o - overplotted points and lines / s and S - stair steps / h - histogram-like vertical lines


############################################################
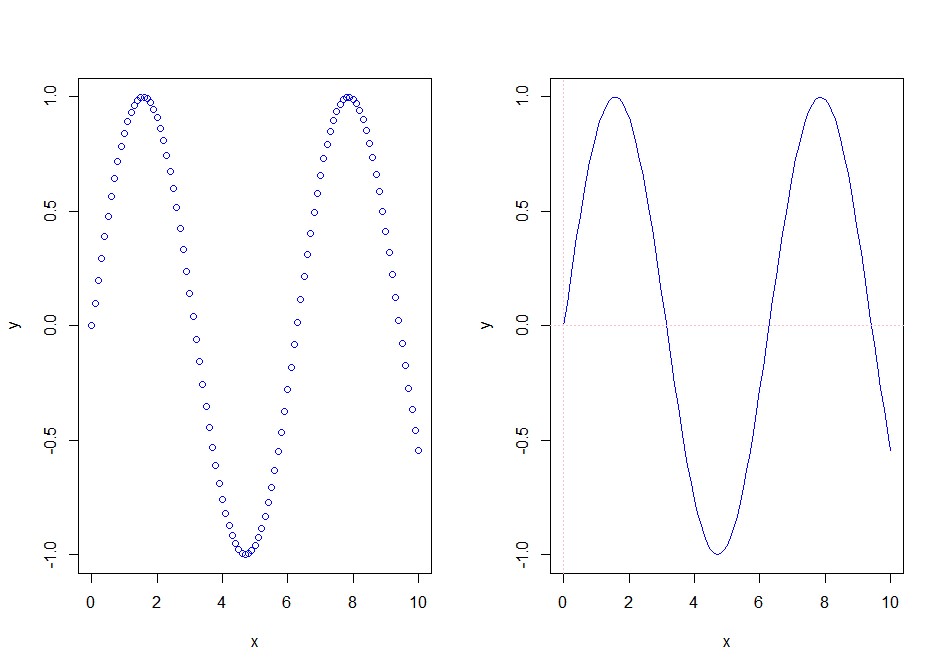
# sin(x) - Sine Curve Function to Graph
############################################################
par( mfrow = c( 1, 2 ) )        # 2 rows and 1 col
x=0:100; x=x/10
y = sin(x)
plot(x, y, cex=1, col="blue")
plot(x, y, cex=1, col="blue", type="l")
abline(v=0, col="pink", lty=21)
abline(h=0, col="pink", lty=21)


############################################################
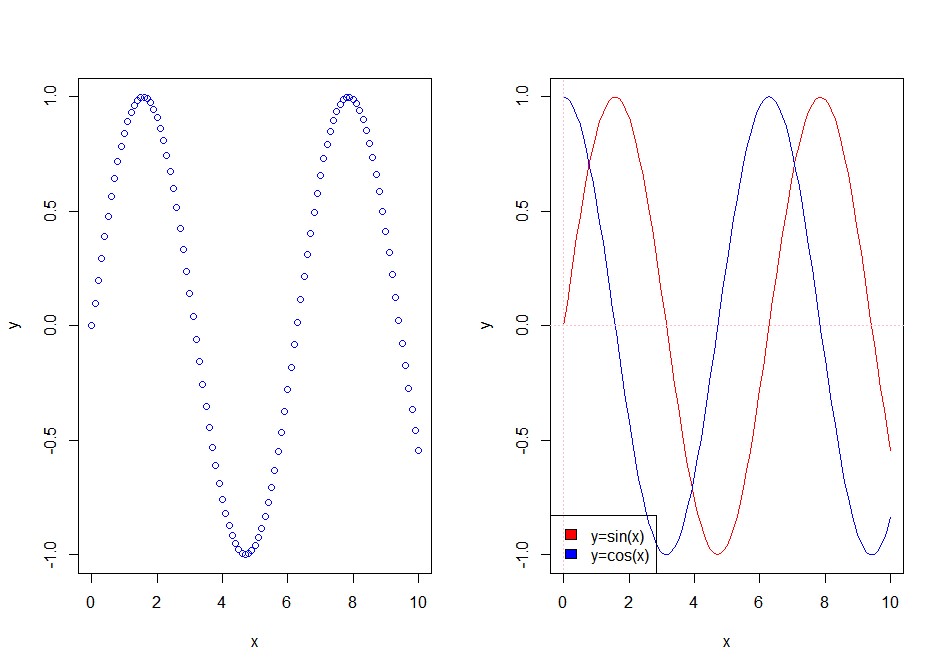
# Two Curves on the Same Panel
############################################################
par( mfrow = c( 1, 2 ) )        # 2 rows and 1 col
x=0:100; x=x/10
y = sin(x)
plot(x, y, cex=1, col="blue")
plot(x, y, cex=1, col="red", type="l")
y = cos(x)
lines(x,y, cex=1, col="blue")
abline(v=0, col="pink", lty=21)
abline(h=0, col="pink", lty=21)
legend("bottomleft", c("y=sin(x)","y=cos(x)"), fill=c("red","blue"))
|


