 1:
 2:
 3:
 4:
 5:
 6:
 7:
 8:
 9:
 10:
 11:
 12:
 13:
 14:
 15:
 16:
 17:
 18:
 19:
 20:
 21:
 22:
 23:
 24:
 25:
 26:
 27:
 28:
 29:
|
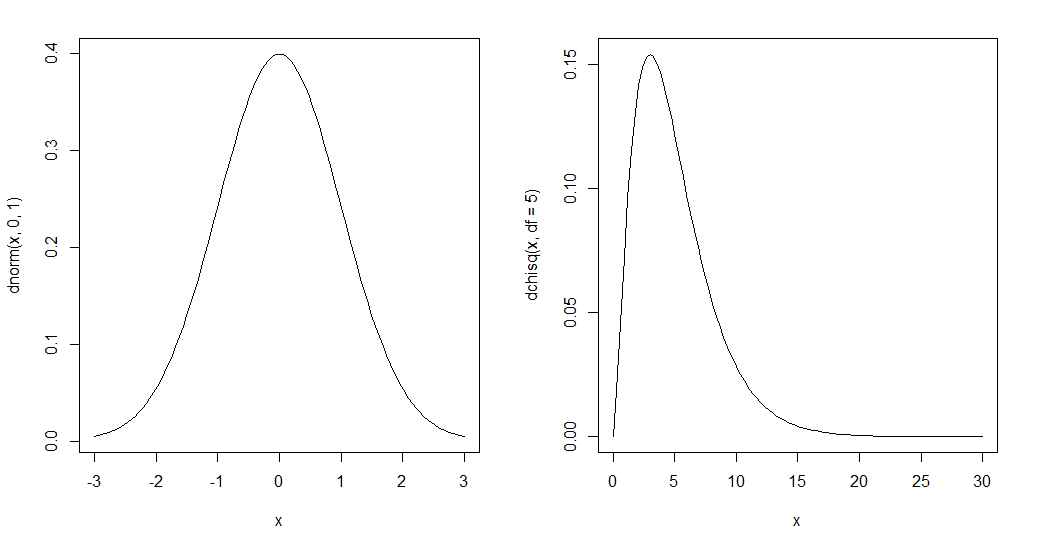
par(mfrow=c(1, 2))
# A Curve for a Normal Distribution
curve(dnorm(x, 0, 1), xlim=c(-3, 3))

# A Curve for a Chisquare Distribution
curve(dchisq(x, df=5), xlim=c(0, 30))


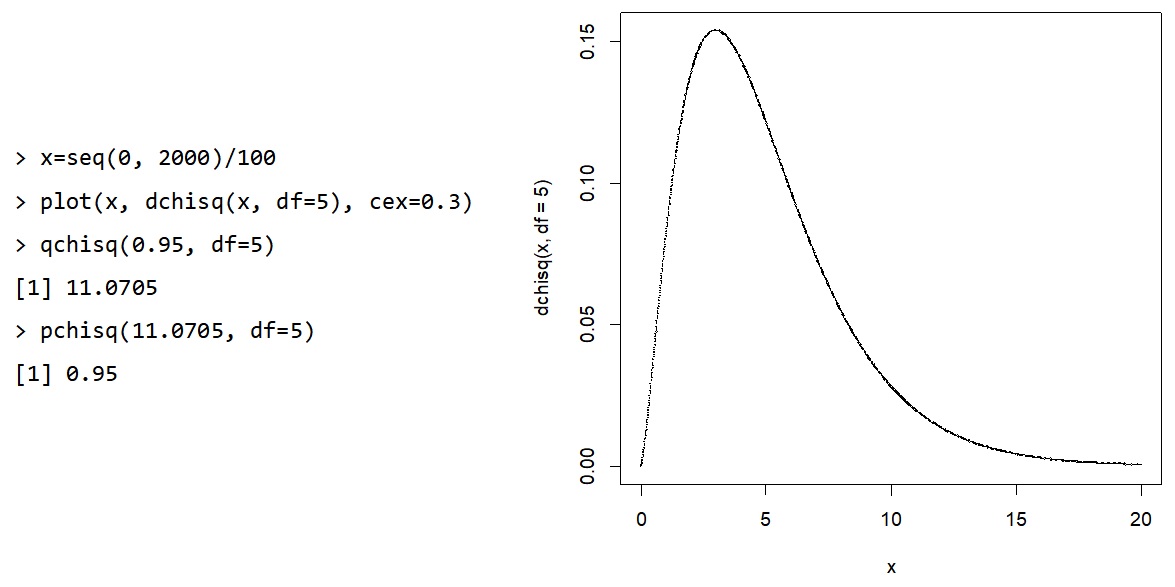
# Different way for a Curve for a Chisquare Distribution
x=seq(0, 2000)/100
plot(x, dchisq(x, df=5), cex=0.3)

qchisq(0.95, df=5)
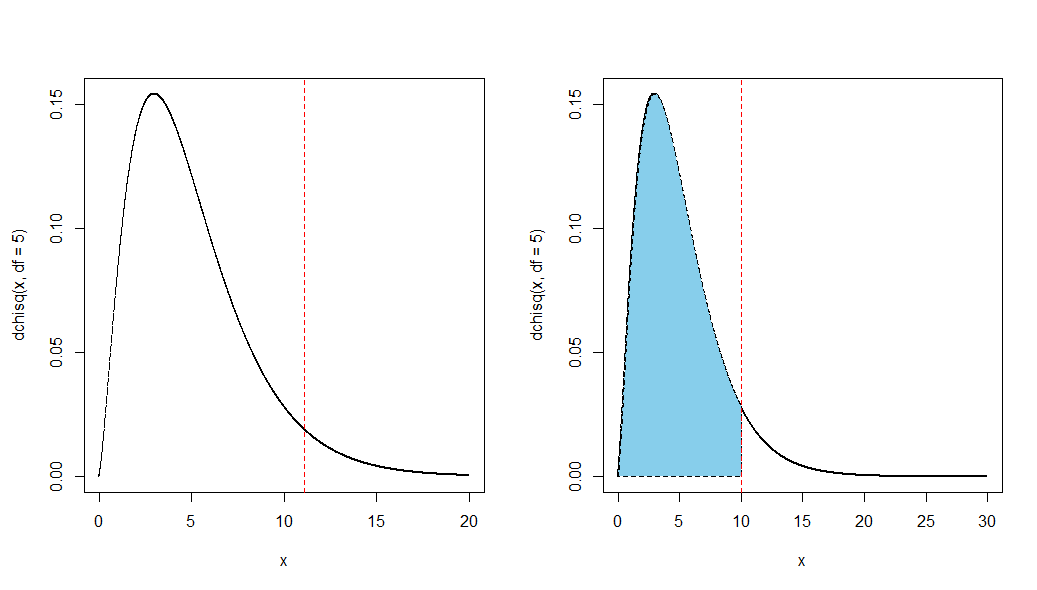
abline(v=qchisq(0.95, df=5), lty=2, col="red")

pchisq(11.0705, df=5)


x = seq(0, 3000)/100
plot(x, dchisq(x, df=5), cex=0.3, xlim=c(0, 30))
x = seq(0, 1000)/100
y = dchisq(x, df=5)
x = c(0, x, 10)
y = c(0, y, 0)
polygon(x, y, col='skyblue', lty=2)
abline(v=10, lty=2, col="red")
|


