 1:
 2:
 3:
 4:
 5:
 6:
 7:
 8:
 9:
 10:
 11:
 12:
 13:
 14:
 15:
 16:
 17:
 18:
 19:
 20:
 21:
 22:
 23:
 24:
 25:
 26:
 27:
 28:
 29:
 30:
 31:
 32:
 33:
 34:
 35:
 36:
 37:
|
# ANOVA / Post-ANOVA ############################################################
la = c(5, 6, 5, 4, 3, 4, 5)
lp = c(1, 0, 1, 2, 1, 0, 0)
ls = c(4, 3, 2, 1, 3, 4, 3)
x = c(la, lp, ls)
g = c(rep("01_La", 7), rep("02_Lp", 7), rep("03_Ls", 7))
g = factor(g)
d=data.frame(x, g)
d
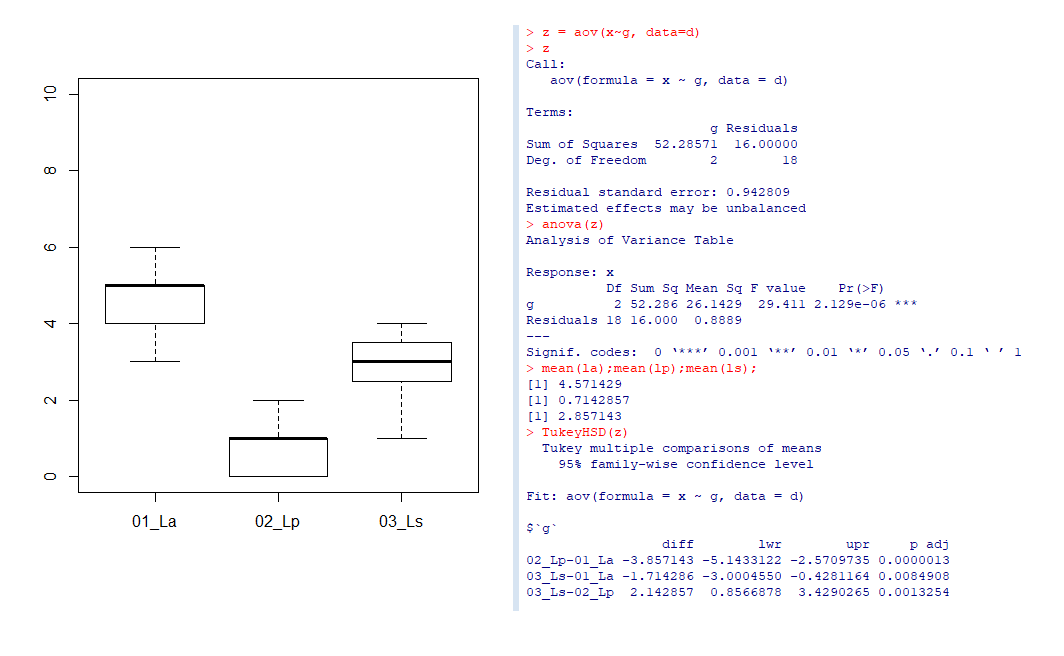
boxplot(x~g, data=d, ylim=c(0,10))

z = aov(x~g, data=d)
z
anova(z)
mean(la);mean(lp);mean(ls);
TukeyHSD(z)


# Enhaced Graphics
x=c(8721, 6388, 9726, 7026, 5417, 10418, 2660, 12756, 12171,
    13274, 4554, 12095, 8434, 3734, 11526, 10144, 6740, 3403,
    10207, 3018, 2360, 4061, 3897, 2273, 5093, 2861, 10382,
    2242, 3960, 3082, 5578, 6445, 10061, 4599, 3922, 2483,
    4833, 8952, 5290, 1716, 9663, 7114, 3468, 2971, 9154)
g=c(rep("01Control", 15), rep("02RS",15), rep("03AX", 15))
g=factor(g)
d=data.frame(x, g)
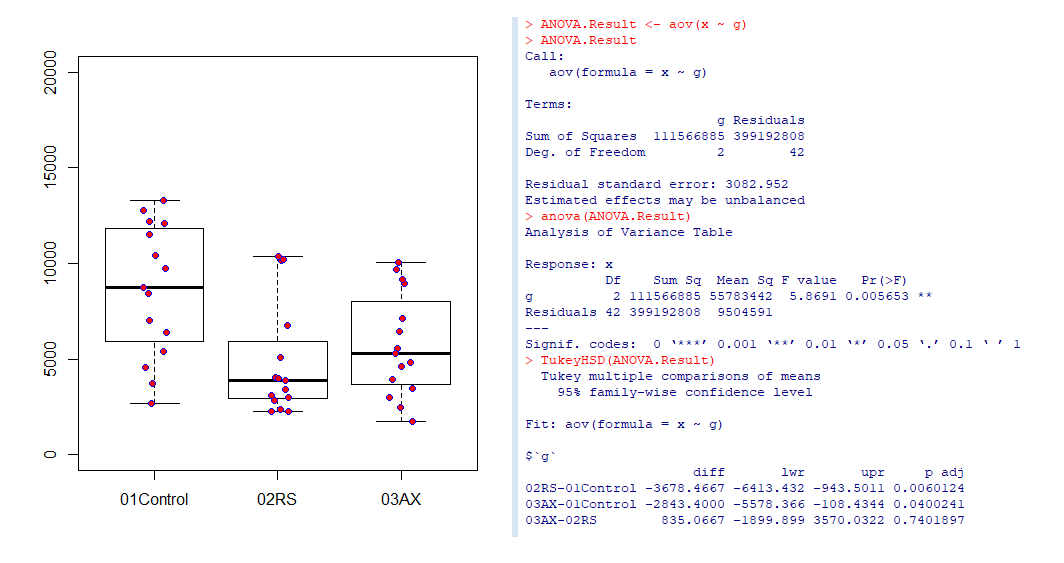
boxplot(x~g, data=d, ylim=c(0,20000))
stripchart(x~g, data=d,
            vertical = TRUE, method = "jitter",
            pch = 21, col = "blue", bg = "red",
            add = TRUE)

ANOVA.Result <- aov(x ~ g)
ANOVA.Result
anova(ANOVA.Result)
TukeyHSD(ANOVA.Result)
|

