 1:
 2:
 3:
 4:
 5:
 6:
 7:
 8:
 9:
 10:
 11:
 12:
 13:
 14:
 15:
 16:
 17:
 18:
 19:
 20:
 21:
 22:
 23:
 24:
 25:
 26:
 27:
 28:
 29:
 30:
 31:
 32:
 33:
 34:
 35:
 36:
 37:
 38:
 39:
 40:
 41:
 42:
 43:
 44:
 45:
 46:
 47:
 48:
 49:
 50:
 51:
 52:
 53:
 54:
 55:
 56:
 57:
 58:
 59:
 60:
 61:
 62:
 63:
 64:
 65:
 66:
 67:
 68:
 69:
 70:
 71:
 72:
 73:
 74:
 75:
 76:
 77:
 78:
 79:
 80:
 81:
 82:
 83:
 84:
 85:
 86:
 87:
 88:
 89:
 90:
 91:
 92:
 93:
 94:
 95:
 96:
 97:
 98:
 99:
 100:
|
# ANOVA using a Vector Object
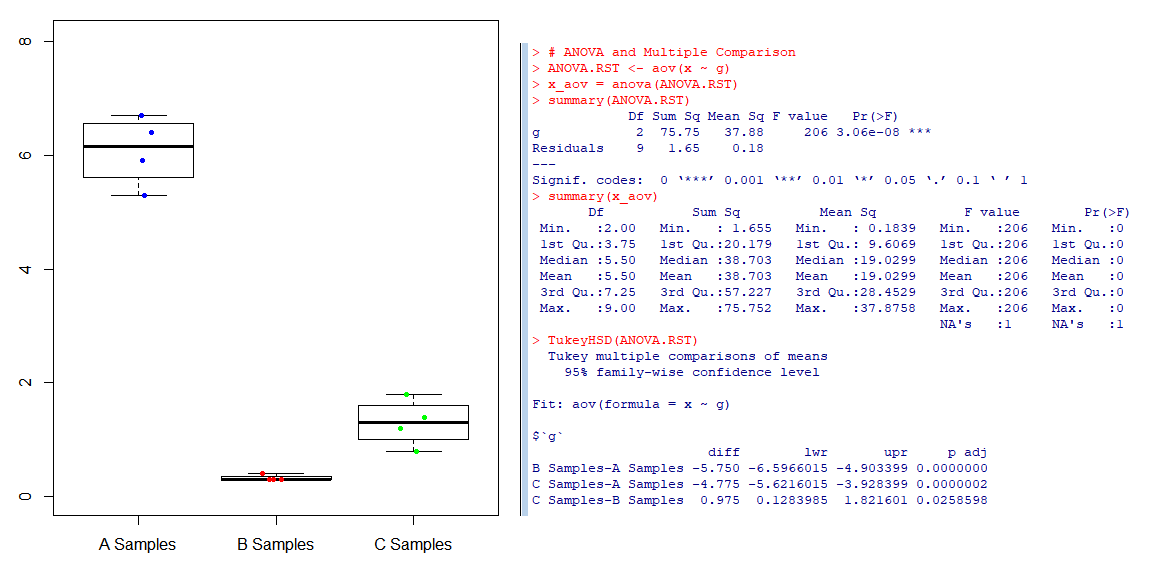
x = c(5.9, 6.7, 5.3, 6.4, 0.4, 0.3, 0.3, 0.3, 1.8, 1.4, 1.2, 0.8)
x

maxX=max(x)*1.2
groups  = c(rep("A Samples", 4), rep("B Samples", 4), rep("C Samples", 4))
g=factor(groups)

colors = c("blue", "red", "green")

d=data.frame(x, g)
boxplot(x~g, data=d, ylim=c(0,maxX))
# Statistical properties of data shown in box plot are as follows
# mean (open square), box (25/75% quantile),
# whisker (5/95% quantile), and asterisks (maximum/minimum).
stripchart(x~g, data=d,
            vertical = TRUE, method = "jitter",
            pch = 20, col = colors, bg = "bisque",
            add = TRUE)


# ANOVA and Multiple Comparison - Tukey
ANOVA.RST <- aov(x ~ g)
x_aov = anova(ANOVA.RST)
summary(ANOVA.RST)
summary(x_aov)
TukeyHSD(ANOVA.RST)


# ANOVA and Multiple Comparison - Duncan
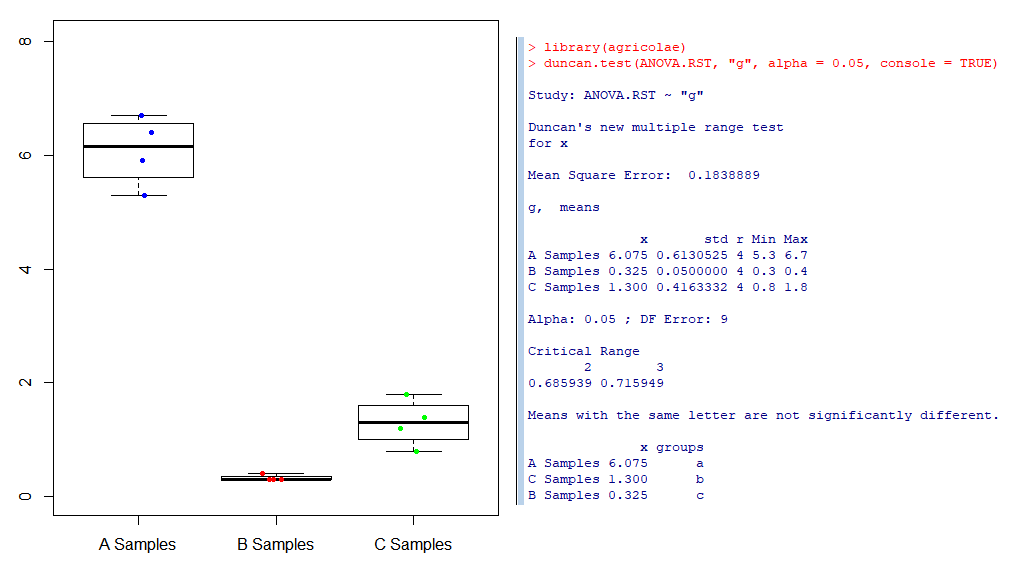
install.packages("agricolae")
library(agricolae)
duncan.test(ANOVA.RST, "g", alpha = 0.05, console = TRUE)


# ANOVA and Multiple Comparison - Graph with Letters
# install.packages("multcomp")
library(multcomp)
x = c(5.9, 6.7, 5.3, 6.4, 0.4, 0.3, 0.3, 0.3, 1.8, 1.4, 1.2, 0.8)
x
maxX=max(x)*1.2
groups  = c(rep("Group_A", 4), rep("Group_B", 4), rep("Group_C", 4))
g=factor(groups)
colors = c("blue", "red", "green")
d=data.frame(x, g)

x_aov = aov(x ~ g, data=d)
s=summary(x_aov)
s
lm = aov(x ~ g, data=d)
anova(x_aov)
anova(lm)

x_aov_mean = model.tables(x_aov,"means")
x_aov_mean
as.numeric(x_aov_mean[[1]]$g)

anova(x_aov)
anova_p = s[[1]][1, 5];
anova_p
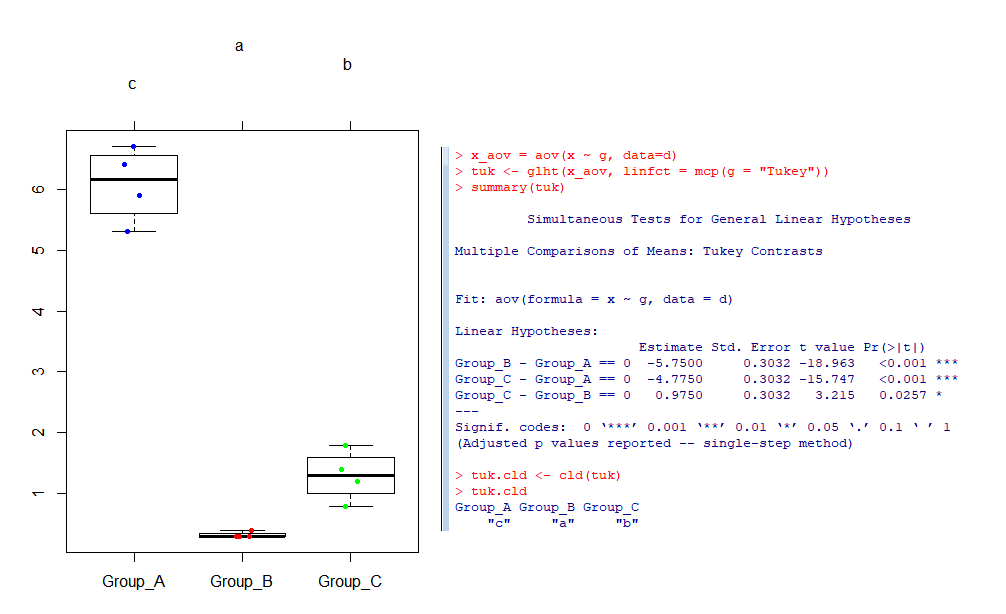
multiComp <- glht(x_aov, linfct = mcp(g = "Tukey"))
confint(multiComp)
plot(print(confint(multiComp)))

summary(multiComp)                                    # For Tukey's Test
summary(multiComp, test=univariate())                 # For repeated-t and Fisher's LSD Test
summary(multiComp, test=adjusted(type="bonferroni"))  # Bonferroni's Test
p.adjust.methods
# Refernce: http://www.math.montana.edu/jobo/st541/mcp.r
# Refernce: https://www.rdocumentation.org/packages/agricolae/versions/1.2-8/topics/LSD.test

multiComp.cld <- cld(multiComp)
multiComp.cld
multiComp.cld <- cld(multiComp, level=0.1)
multiComp.cld
summary(multiComp.cld)
multiComp.cld[[10]]
multiComp.cld[[10]]$Letters
as.character(multiComp.cld[[10]]$Letters)

mean_by_group = tapply(x, g, mean)
mean_by_group
as.numeric(mean_by_group)

sd_by_group = tapply(x, g, sd)
sd_by_group
as.numeric(sd_by_group)

par(oma   = c(2, 2, 2, 2))     # spaces for all sides.
par(mar   = c(2, 2, 7, 2))     # spaces for all sides.
plot(multiComp.cld)
#box("inner" , col="gray" , lty=12)    # "plot", "figure", "inner" and "outer"

stripchart(x~g, data=d,
            vertical = TRUE, method = "jitter",
            pch = 20, col = colors, bg = "bisque",
            add = TRUE)
|


