 1:
 2:
 3:
 4:
 5:
 6:
 7:
 8:
 9:
 10:
 11:
 12:
 13:
 14:
 15:
 16:
 17:
 18:
 19:
 20:
 21:
 22:
 23:
 24:
 25:
 26:
 27:
 28:
 29:
 30:
 31:
 32:
 33:
 34:
 35:
 36:
 37:
 38:
 39:
 40:
 41:
 42:
 43:
 44:
 45:
 46:
 47:
 48:
 49:
 50:
 51:
 52:
 53:
 54:
 55:
 56:
 57:
 58:
 59:
 60:
 61:
 62:
 63:
 64:
 65:
 66:
 67:
|
# PCA
par(mfrow=c(1,2))
rawData = read.table(header = TRUE, text =
"R1 R2 R3 R4 R5 R6 F1 F2 F3 F4 F5 F6
Bact001 5.9 6.7 5.3 6.4 6.7 5.8 1.0 1.6 1.8 1.4 1.2 0.8
Bact002 0.1 0.2 0.1 0.1 0.1 0.2 0.0 0.1 0.1 0.0 0.1 0.1
Bact003 0.4 0.6 0.7 1.4 1.0 0.4 0.0 0.1 0.1 0.1 0.1 0.1
Bact004 0.1 0.1 0.1 0.1 0.2 0.1 0.0 0.0 0.0 0.0 0.1 0.1
Bact005 0.4 0.3 0.3 0.3 0.3 0.2 0.1 0.1 0.1 0.1 0.1 0.1
Bact006 0.2 0.1 0.1 0.1 0.2 0.3 0.2 0.2 0.1 0.1 0.2 0.2
Bact007 1.3 1.5 0.9 0.4 0.8 1.0 4.1 3.3 2.8 4.0 5.1 3.8
Bact008 1.2 1.9 0.5 0.2 1.1 0.9 1.7 1.8 1.5 1.1 1.9 2.6")
rawData

tRawData = t(rawData)
# write.table(t(rawData), file="tData.txt", sep = "/t", eol = "/n")

groups  = c(rep("Con", 6), rep("Treatment", 6))
cols = c('red', 'green')[factor(groups)]
pca = prcomp(t(rawData), scale=TRUE) # scale=TRUE 옵션 반드시 사용할 것.
pca = prcomp(t(rawData))
pca$x
pca$sdev
pca$rotation
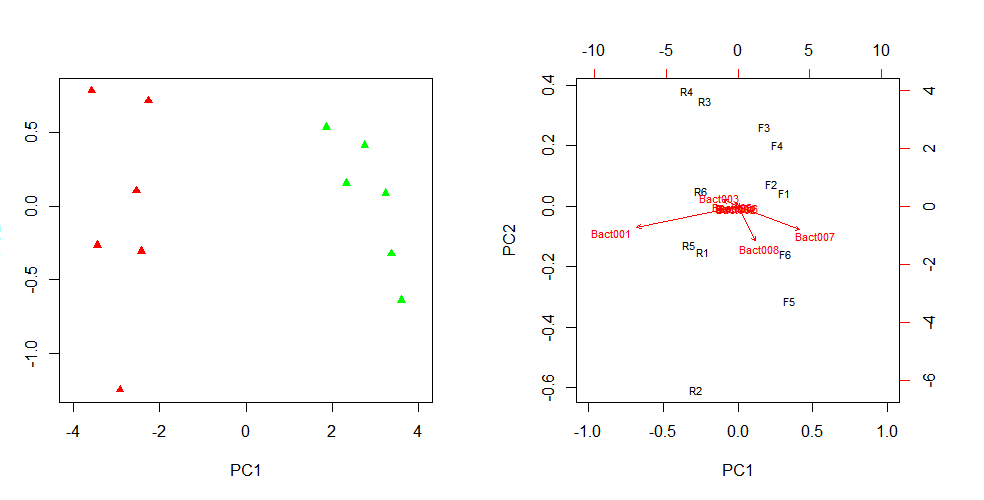
plot(pca$x, xlim=c(-4, 4), col=cols, pch=17, bg=cols)

# Biplot
biplot(pca, xlim=c(-1.0, 1.0), cex=0.7, scale=T, arrow.len=0.05, expand=2.5)
biplot(pca, xlim=c(-1.0, 1.0), ylim=c(-0.8, 0.8), cex=0.7, scale=F)
biplot(pca, cex=0.7, scale=T, xlim=c(-0.6,+0.6))
biplot(pca, cex=0.7, scale=T, arrow.len=0.05, expand=1)
biplot(pca, cex=0.7, scale=T, arrow.len=0.05, expand=2, col=c("green", "red", "yellow", "blue"))


# Arrows
par(mfrow=c(1,2))
pca$x
pca$sdev
maxX = max(abs(pca$x[,1]))*1.5
maxY = max(abs(pca$x[,2]))*1.5
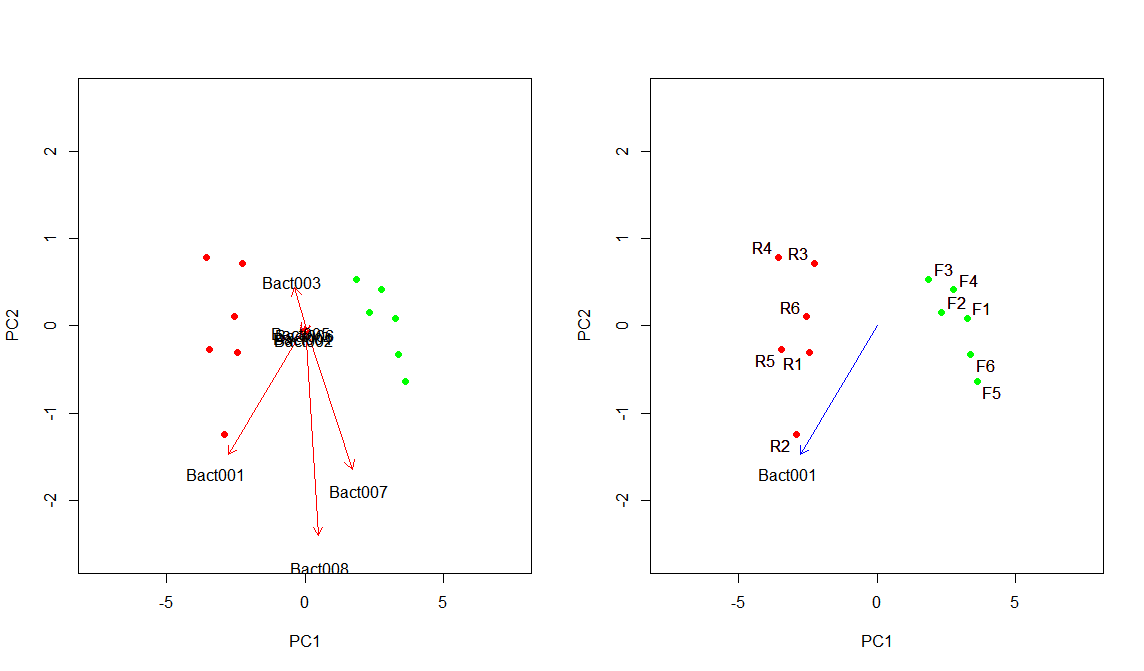
plot(pca$x, col=cols, pch=20, cex=1.5, xlim=c(-maxX*1.4, maxX*1.4), ylim=c(-maxY*1.4, maxY*1.4))
points(pca$x[,1:2], col=cols, pty=20)
arrows(rep(0, 10), rep(0,12), pca$rotation[,1]*3.3, pca$rotation[,2]*3.3, col="red", length=0.1)
text(pca$rotation[,1]*3.8, pca$rotation[,2]*3.8, rownames(pca$rotation), col="black", cex=1)
plot(pca$x, col=cols, pch=20, cex=1.5, xlim=c(-maxX*1.4, maxX*1.4), ylim=c(-maxY*1.4, maxY*1.4))
arrows(0, 0, pca$rotation[1,1]*3.3, pca$rotation[1,2]*3.3, col="blue", length=0.1)
text(pca$rotation[1,1]*3.8, pca$rotation[1,2]*3.8, rownames(pca$rotation)[1], col="black", cex=1)

#install.packages("calibrate")
library(calibrate)
textxy(pca$x[,1], pca$x[,2], colnames(rawData), cex=1, col="black")


# 3D Scatterplot
library(scatterplot3d)
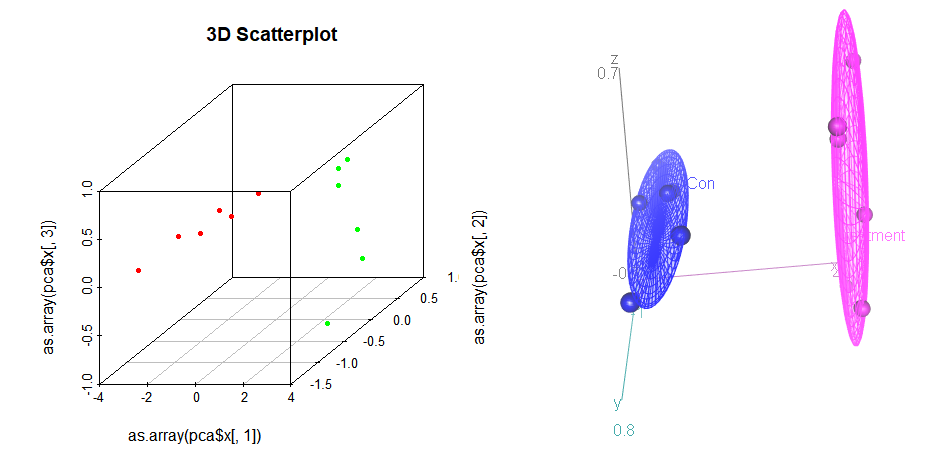
scatterplot3d(as.array(pca$x[,1]),as.array(pca$x[,2]),as.array(pca$x[,3]), main="3D Scatterplot", color=cols, type="p", pch=20)


x=pca$x[,1]
y=pca$x[,2]
z=pca$x[,3]

library(scatter3d)
library(Rcmdr)
scatter3d(z ~ x + y| factor(groups) , surface=FALSE, ellipsoid=TRUE, revolutions=1, data=Duncan)
|


