 1:
 2:
 3:
 4:
 5:
 6:
 7:
 8:
 9:
 10:
 11:
 12:
 13:
 14:
 15:
 16:
 17:
 18:
 19:
 20:
 21:
 22:
 23:
 24:
 25:
 26:
 27:
 28:
 29:
 30:
 31:
 32:
 33:
 34:
 35:
 36:
 37:
 38:
 39:
 40:
 41:
 42:
 43:
 44:
 45:
 46:
 47:
 48:
 49:
|
library(rgl)
library(devtools)
install_github("vqv/ggbiplot")
library(ggbiplot)

# PCA
pcadata <- princomp(iris[,1:4], cor=T, scores=T)
# cor = T: Use the correlation matrix or the covariance matrix
# score = T: each principal component calculated!

# summary
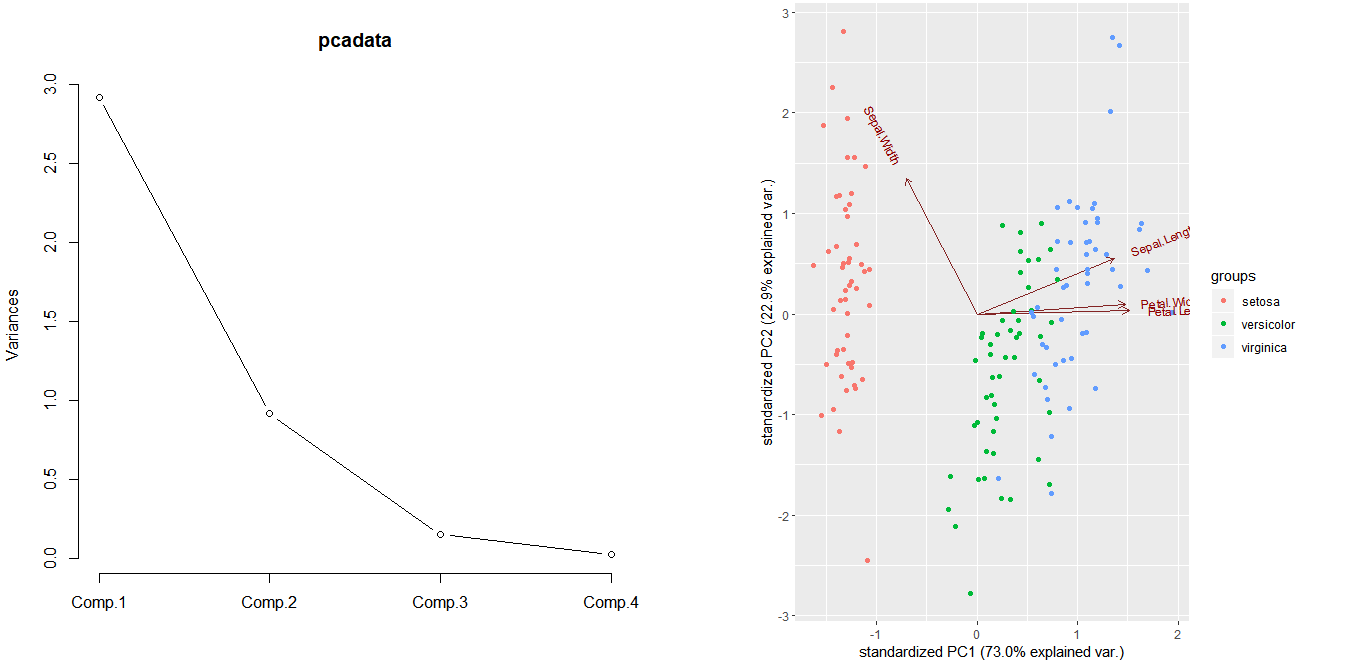
plot(pcadata, type='l')
summary(pcadata)

# 2d score plot
ggbiplot(pcadata,groups = iris$Species)

# loading plot
plot(pcadata$loadings[,1:2], col=c('black','blue','red','green'), pch=16)
legend('topleft',
	 c('Sepal.Length','Sepal.Width','Petal.Length','Petal.Width'),
     text.col=c('black','blue','red','green'))


install.packages("devtools")  # also need install ggplot2
library("devtools")
install_github("ggbiplot")

library("ggbiplot")
data(wine)
wine.pca <- prcomp(wine,scale.=TRUE)
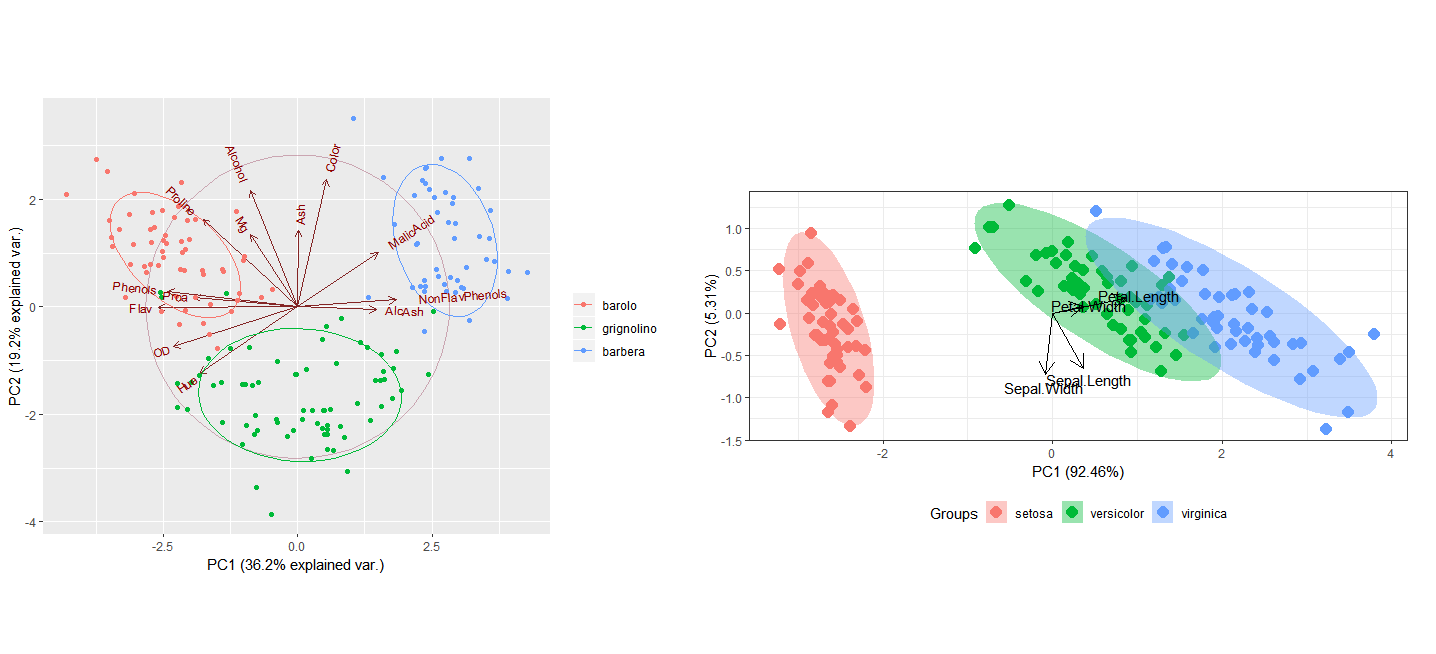
g<-ggbiplot(wine.pca, obs.scale=1, var.scale=1, groups=wine.class, ellipse=TRUE, circle=TRUE)
g<-g+scale_color_discrete(name="")
print(g)


library(devtools)
install_github('fawda123/ggord')
library(ggord)
ord <- prcomp(iris[, 1:4])
p <- ggord(ord, iris$Species)
p
p + scale_colour_manual('Species', values = c('purple', 'orange', 'blue'))
p + theme_classic()
p + theme(legend.position = 'bottom')
p + scale_x_continuous(limits = c(-4, 4))
|

