 1:
 2:
 3:
 4:
 5:
 6:
 7:
 8:
 9:
 10:
 11:
 12:
 13:
 14:
 15:
 16:
 17:
 18:
 19:
 20:
 21:
 22:
 23:
 24:
 25:
 26:
 27:
 28:
 29:
 30:
 31:
 32:
 33:
 34:
 35:
 36:
 37:
 38:
 39:
 40:
 41:
 42:
 43:
 44:
 45:
 46:
 47:
 48:
 49:
 50:
|
############################################################
# Data
q  = "Question No 3";
e  = c(0,1,2,3,4) # Be careful
h  = c("Lowest\n0", "Low\n1", "Normal\n2", "High\n3", "Highest\n4")
h2 = c("Lowest", "Low", "Normal", "High", "Highest")
f1 = c(18,91,154,79,34)    # Frequencies before treatment
f2 = c(17,75,161,100,19)   # Frequencies after treatment


plot.new();                # Initiation of graphic panel 그래프 초기화
par(mfrow=c(1,2))          # Graphic panel separation

p1 = f1/sum(f1)            # probabilities before treatment
p2 = f2/sum(f2)            # probabilities after treatment
ex1= format(sum(e*p1), digits=0, nsmall=2)   # Expected score before treatment
ex2= format(sum(e*p2), digits=0, nsmall=2)   # Expected score after treatment

names(f1)=paste(h2,"\n(",format(p1*100, digits=0, nsmall=1),"%)", sep="")
names(f2)=paste(h2,"\n(",format(p2*100, digits=0, nsmall=1),"%)", sep="")

data = rbind(f1,f2)
colnames(data)=h
data
c=chisq.test(data)
pval=format(c$p.value, digits=0, nsmall=5)
summary(chisq.test(data))

############################################################
# Pie Chart
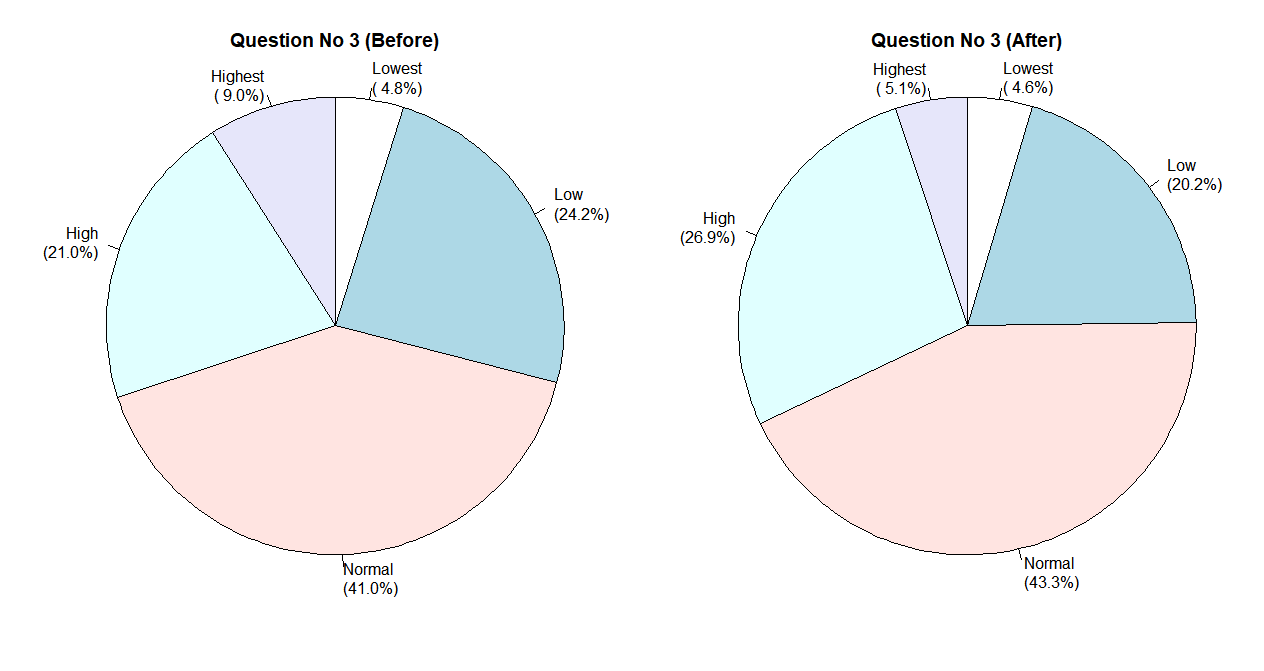
pie(f1, main = paste(q," (Before)",sep=""), radius=1, clockwise = TRUE, cex=1);
pie(f2, main = paste(q," (After)",sep=""), radius=1, clockwise = TRUE, cex=1);

############################################################
# Bar Plot with Legends
data1 = rbind(p1*100,p2*100)
colnames(data1) = h;
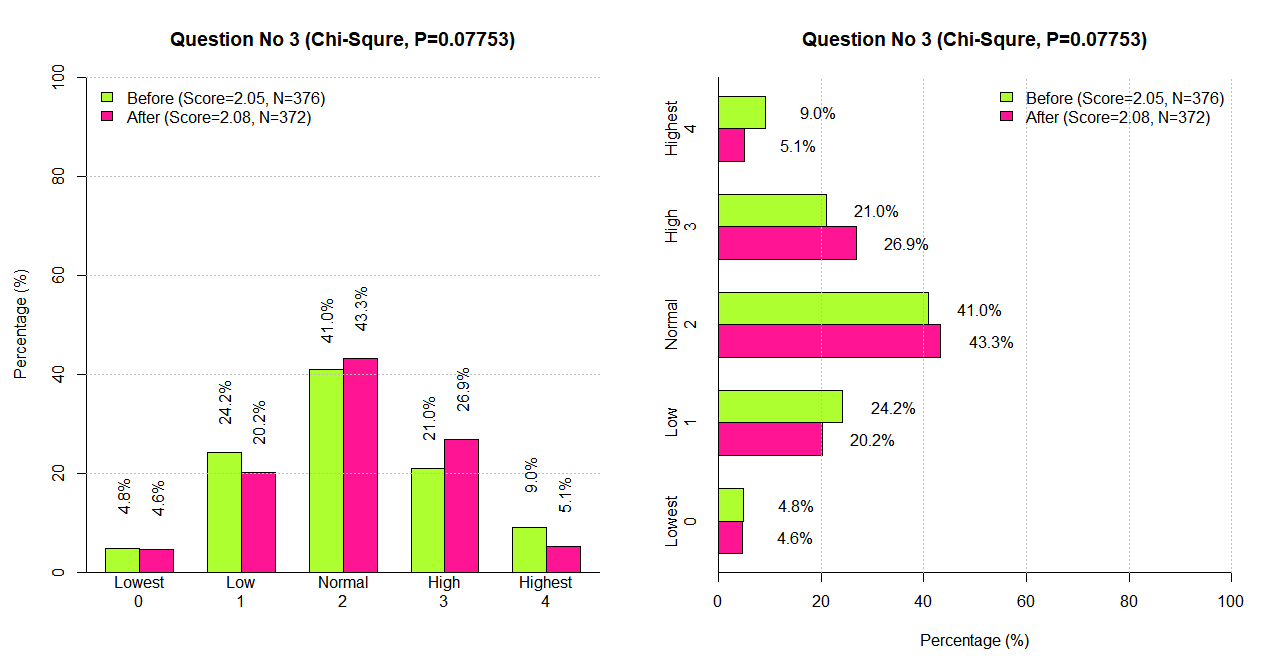
xpos=barplot(data1, main = paste(q, " (Chi-Squre, P=",pval,")",sep=""), beside=TRUE, col=c("greenyellow", "deeppink"), ylim=c(0,100), ylab="Percentage (%)")
abline(h=0, col="black")
abline(h=c(20,40,60,80,100), lty='dotted', col='gray')
legend("topleft", c(paste("Before (Score=", ex1, ", N=",sum(f1),")", sep=""), paste("After (Score=", ex2, ", N=",sum(f2),")", sep="")), cex=1, bty="n", fill=c("greenyellow", "deeppink"));
text(y= data1+10, x= xpos, labels=as.character(paste(format(data1, digits=2, nsmall=1),"%",sep="")), xpd=TRUE, cex=1, srt=90)

data2 = rbind(p2*100,p1*100)
colnames(data2) = h;
ypos = barplot(data2, main = paste(q, " (Chi-Squre, P=",pval,")",sep=""), beside=TRUE, col=c("deeppink", "greenyellow"), xlim=c(0,100), horiz=TRUE, xlab="Percentage (%)")
abline(v=0, col="black")
abline(v=c(20,40,60,80,100), lty='dotted', col='gray')
legend("topright", c(paste("Before (Score=", ex1, ", N=",sum(f1),")", sep=""), paste("After (Score=", ex2, ", N=",sum(f2),")", sep="")), cex=1, bty="n", fill=c("greenyellow", "deeppink"));
text(x= data2+10, y= ypos, labels=as.character(paste(format(data2, digits=2, nsmall=1),"%",sep="")), xpd=TRUE, cex=1)
|

