 1:
 2:
 3:
 4:
 5:
 6:
 7:
 8:
 9:
 10:
 11:
 12:
 13:
 14:
 15:
 16:
 17:
 18:
 19:
 20:
 21:
 22:
 23:
 24:
|
############################################################
# pch - point types
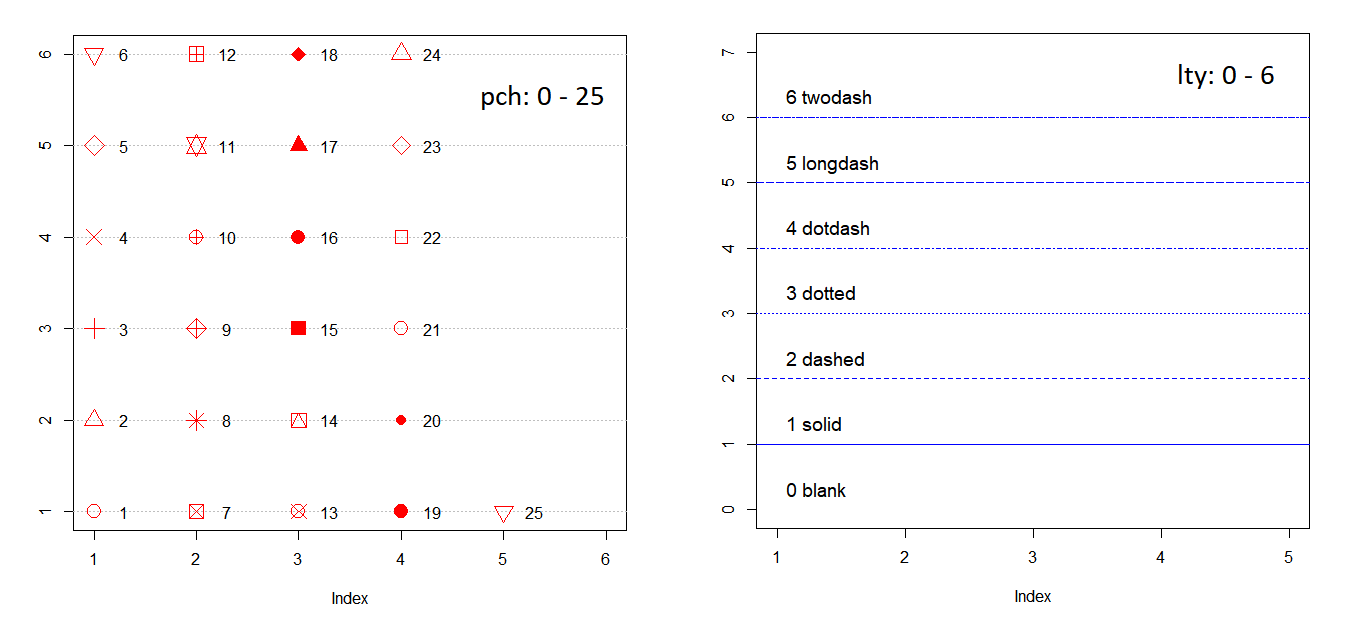
plot(NA, xlim=c(1, 6), ylim=c(1, 6), ylab="")
abline(h=1, lty=21, col="gray"); abline(h=2, lty=21, col="gray")
abline(h=3, lty=21, col="gray"); abline(h=4, lty=21, col="gray")
abline(h=5, lty=21, col="gray"); abline(h=6, lty=21, col="gray")
for(i in 1:6) {
  for (j in 1:6) {
    if((i-1)*6+j < 26) {
      points(i, j, pch=(i-1)*6+j, cex=2, col="red");
      text(i+0.3, j, as.character((i-1)*6+j), col="black");
    }
  }
}


############################################################
# lty - line types
plot(NA, xlim=c(1, 5), ylim=c(0, 7), ylab="")
lineName = c("blank", "solid", "dashed", "dotted", "dotdash", "longdash", "twodash")
for(i in 0:6) {
  abline(h=i, lty = i, col="blue", cex=2)
  text(1, i+0.3, paste(i, lineName[i+1], sep=" "), pos=4, cex=1.2);
}
|
