 1:
 2:
 3:
 4:
 5:
 6:
 7:
 8:
 9:
 10:
 11:
 12:
 13:
 14:
 15:
 16:
 17:
 18:
 19:
 20:
 21:
 22:
 23:
 24:
 25:
 26:
 27:
 28:
 29:
 30:
 31:
 32:
 33:
 34:
|
############################################################
# Line/Curve Function and Plotting
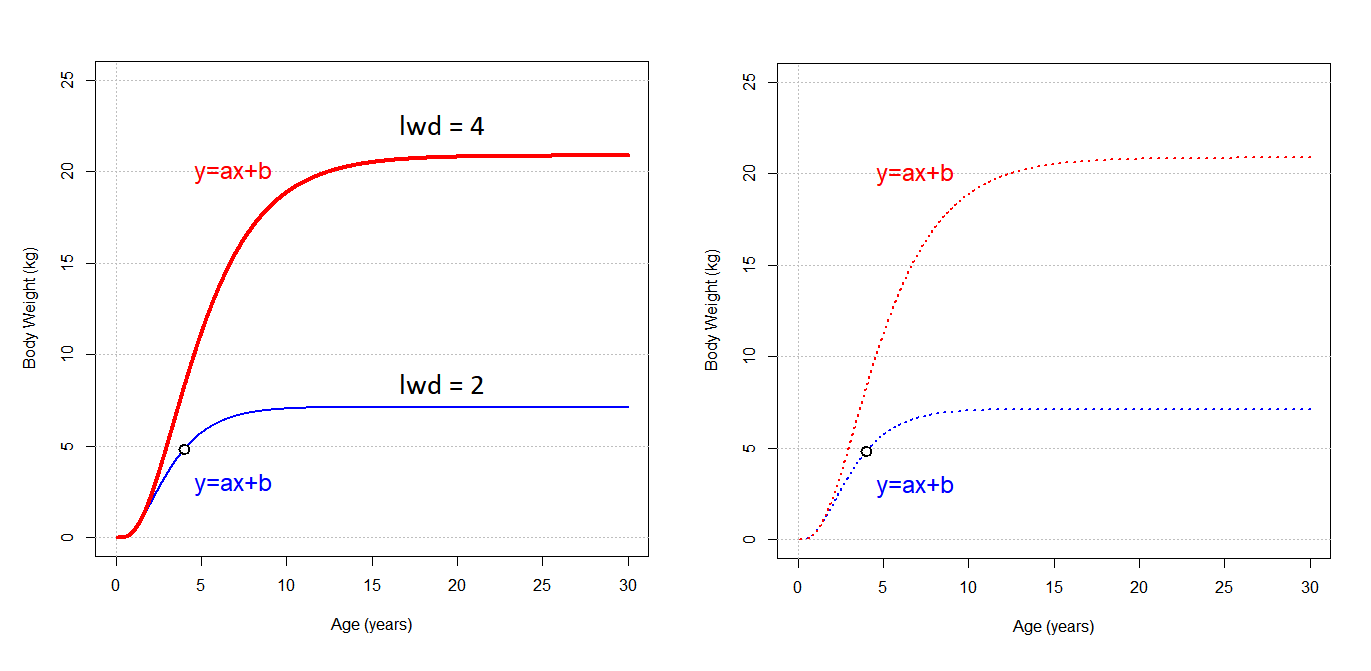
x=seq(from=0, to=30, by=0.01)
y1=7.14*(1-exp(1)^(-0.55*(x-0.08)))^3.1712
y2=20.86*(1-exp(1)^(-0.35*(x-0.09)))^3.1479

plot(x,y1,type="l", lwd=2, col="blue", ylim=c(0,25), xlab='Age (years)', ylab='Body Weight (kg)')
abline(v= 0, lty='dotted', col='gray')
abline(h= 0, lty='dotted', col='gray')
abline(h= 5, lty='dotted', col='gray')
abline(h=10, lty='dotted', col='gray')
abline(h=15, lty='dotted', col='gray')
abline(h=20, lty='dotted', col='gray')
abline(h=25, lty='dotted', col='gray')
lines(x,y2,col="red", lwd=4)
text(4,  3, pos=4, labels='y=ax+b', col='blue', cex=1.5)
text(4, 20, pos=4, labels='y=ax+b', col='red', cex=1.5)
points(4,7.14*(1-exp(1)^(-0.55*(4-0.08)))^3.1712, pch=21, lwd=2, col='black', bg='white', cex=1.5)


plot(x,y1,type="l", lty=3, lwd=2, col="blue", ylim=c(0,25), xlab='Age (years)', ylab='Body Weight (kg)')
abline(v= 0, lty='dotted', col='gray')
abline(h= 0, lty='dotted', col='gray')
abline(h= 5, lty='dotted', col='gray')
abline(h=10, lty='dotted', col='gray')
abline(h=15, lty='dotted', col='gray')
abline(h=20, lty='dotted', col='gray')
abline(h=25, lty='dotted', col='gray')
lines(x,y2,col="red", lty=3, lwd=2)
text(4,  3, pos=4, labels='y=ax+b', col='blue', cex=1.5)
text(4, 20, pos=4, labels='y=ax+b', col='red', cex=1.5)
points(4,7.14*(1-exp(1)^(-0.55*(4-0.08)))^3.1712, pch=21, lwd=2, col='black', bg='white', cex=1.5)
|
