 1:
 2:
 3:
 4:
 5:
 6:
 7:
 8:
 9:
 10:
 11:
 12:
 13:
 14:
 15:
 16:
 17:
 18:
 19:
 20:
 21:
 22:
 23:
 24:
 25:
 26:
 27:
|
############################################################
# Barplot with Error Bars
# install.packages("ggplot2")
library("ggplot2")

d = read.table(header=T, text="
Parameter exp1 exp2 exp3 exp4 Group Mean STDev
Param_A 256 248 234 266 Con 251.0 11.7
Param_B 190 180 189 185 Con 186.0 3.9
Param_A 42 50 45 48 T1 46.3 3.0
Param_B 300 308 310 320 T1 309.5 7.1
")
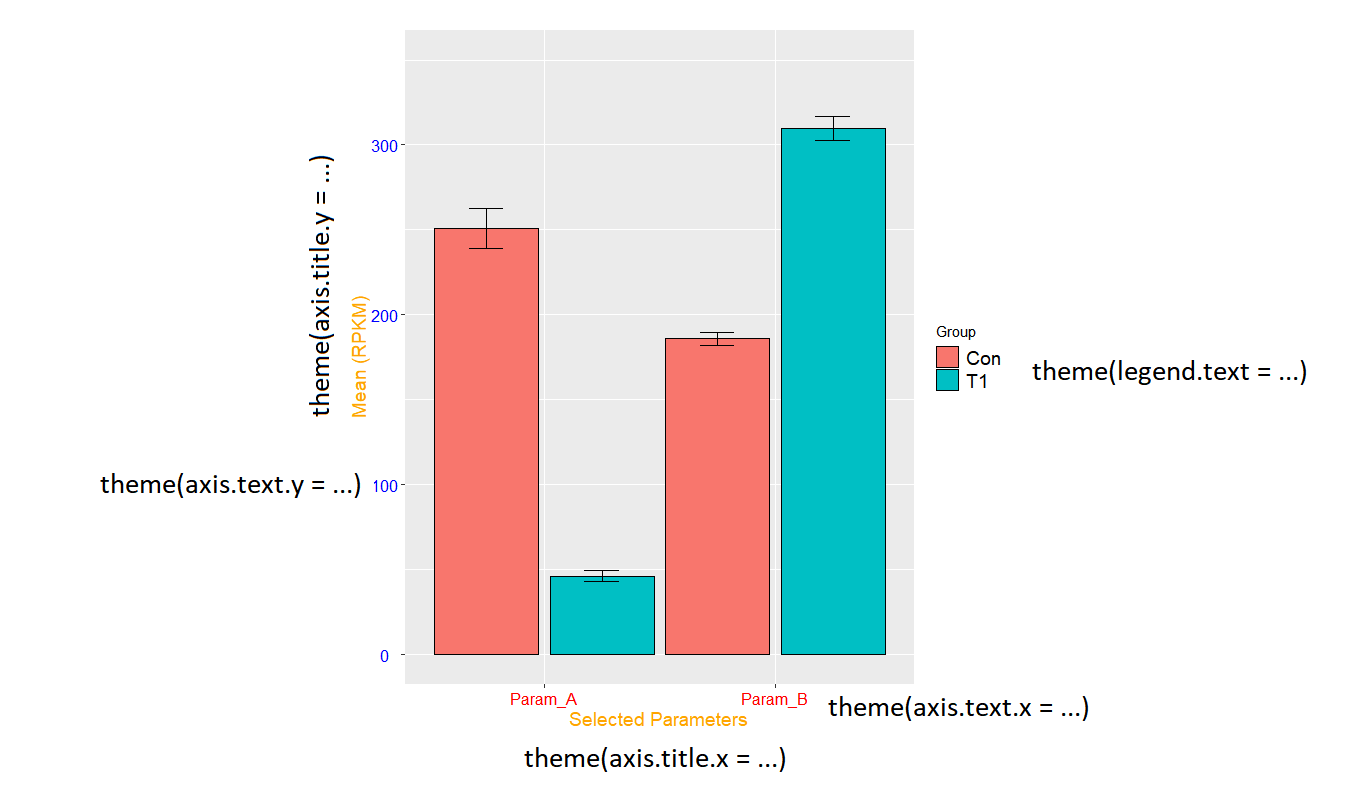
d


ggplot(d, aes(x=as.factor(Parameter), xlab="aaa", y=Mean, fill=Group)) +
geom_bar(position=position_dodge(1), width=0.9, stat="identity", colour='black') +
geom_errorbar(aes(ymin=Mean-STDev, ymax=Mean+STDev), width=0.3, position=position_dodge(1)) +
ylim(0, 350) +
ylab("Mean (RPKM)") +
xlab("Selected Parameters") +
theme(legend.text  = element_text(size=14)) +
theme(axis.text.x  = element_text(angle = 0, hjust = 0.5, size=12, color="red")) +
theme(axis.text.y  = element_text(angle = 0, hjust = 0.5, size=12, color="blue")) +
theme(axis.title.x = element_text(angle = 0, hjust = 0.5, size=14, color="orange")) +
theme(axis.title.y = element_text(angle =90, hjust = 0.5, size=14, color="orange"))
|
