 1:
 2:
 3:
 4:
 5:
 6:
 7:
 8:
 9:
 10:
 11:
 12:
 13:
 14:
 15:
 16:
 17:
 18:
 19:
 20:
 21:
 22:
 23:
 24:
 25:
 26:
 27:
 28:
 29:
 30:
 31:
 32:
 33:
 34:
 35:
 36:
 37:
 38:
 39:
 40:
 41:
 42:
 43:
 44:
 45:
|
############################################################
# Bar Plot with Error Bars
par(mfrow=c(1,1))

sd.p = function(x) {
  m = mean(x);
  ss = 0;

  for(i in 1:length(x)) {
    ss = ss + (x[i] - m)^2;
  }
  return(sqrt(ss/length(x)));
}

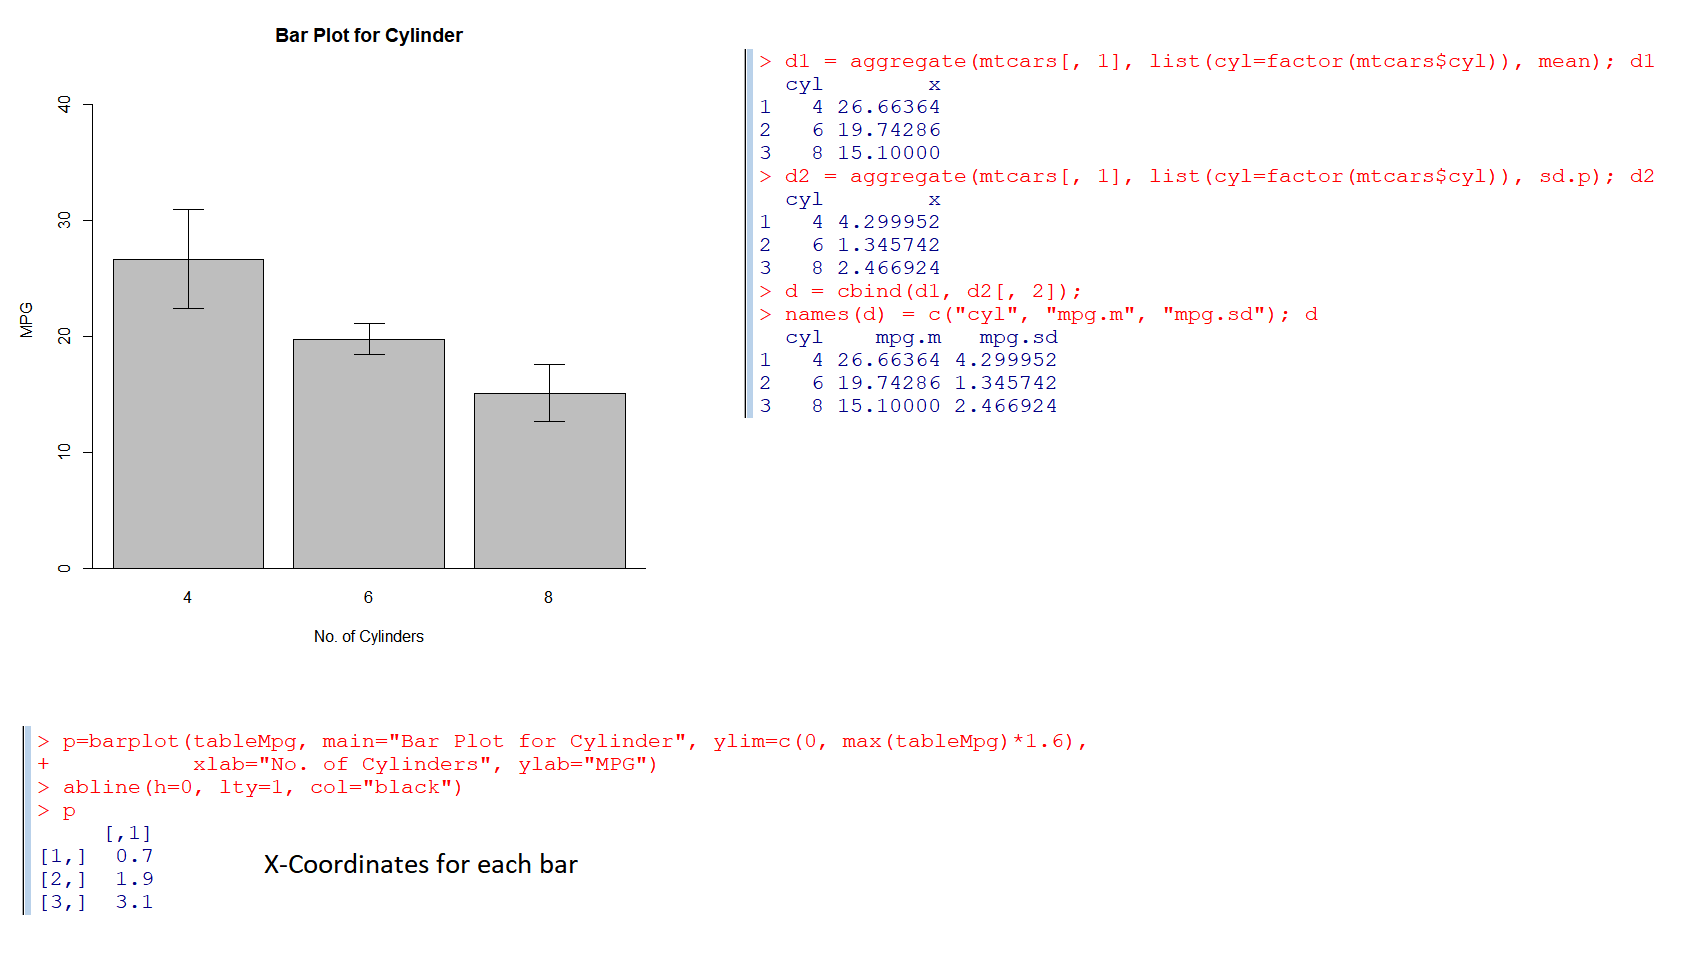
d1 = aggregate(mtcars[, 1], list(cyl=factor(mtcars$cyl)), mean); d1
d2 = aggregate(mtcars[, 1], list(cyl=factor(mtcars$cyl)), sd.p); d2
d = cbind(d1, d2[, 2]);
names(d) = c("cyl", "mpg.m", "mpg.sd"); d

tableMpg = structure(d$mpg.m, .Dim = 3, .Dimnames = structure(list(
    d1$cyl), .Names = "Cylinders"), class = "table")
tableMpg


p=barplot(tableMpg, main="Bar Plot for Cylinder", ylim=c(0, max(tableMpg)*1.6),
          xlab="No. of Cylinders", ylab="MPG")
abline(h=0, lty=1, col="black")
p

funcErrorBars = function(x, y, xAdd, yAdd) {
  x.y_verti  = list(x=c(x, x), y=c(y-yAdd, y+yAdd));
  lines(x.y_verti, lty=1, col="black");
  x.y_horiz1 = list(x=c(x-xAdd, x+xAdd), y=c(y+yAdd, y+yAdd));
  lines(x.y_horiz1, lty=1, col="black");
  x.y_horiz2 = list(x=c(x-xAdd, x+xAdd), y=c(y-yAdd, y-yAdd));
  lines(x.y_horiz2, lty=1, col="black");
}

sd.y = d$mpg.sd
y    = d$mpg.m
d
for(i in 1:3) {
  funcErrorBars(p[,1][i], y[i], 0.1, sd.y[i]);
}
|
