 1:
 2:
 3:
 4:
 5:
 6:
 7:
 8:
 9:
 10:
 11:
 12:
 13:
 14:
 15:
 16:
 17:
 18:
 19:
 20:
 21:
 22:
 23:
 24:
 25:
 26:
 27:
 28:
 29:
 30:
 31:
 32:
 33:
 34:
 35:
|
##Install packages (venn, limma package)
source("http://bioconductor.org/biocLite.R")
biocLite("limma") ## venn
install.packages("venn") ##vennDiagram
library(limma)
library(venn)
library(gplots)

data = read.table(header = TRUE, text = "Cattle_feces Cattle_dust Horse_feces Horse_dust
4430921 0 0 0 4
827522 0 4 0 0
329134 1 0 4 0
3160509 1 0 0 3
344114 1 3 1 2
4375017 1 0 3 0
528362 1 0 3 10
243954 1 4 1 2
296962 1 0 0 2
4307330 0 2 3 0
512892 0 45 0 0
317703 0 0 3 1
165487 0 0 0 1
112487 0 0 4 0
32487 0 3 4 1
321487 1 4 0 0")

head(data) ##Check
data != "0"
OTUs_Presence = (data != "0")
OTUs_Presence = as.data.frame(OTUs_Presence)
OTUs_Presence

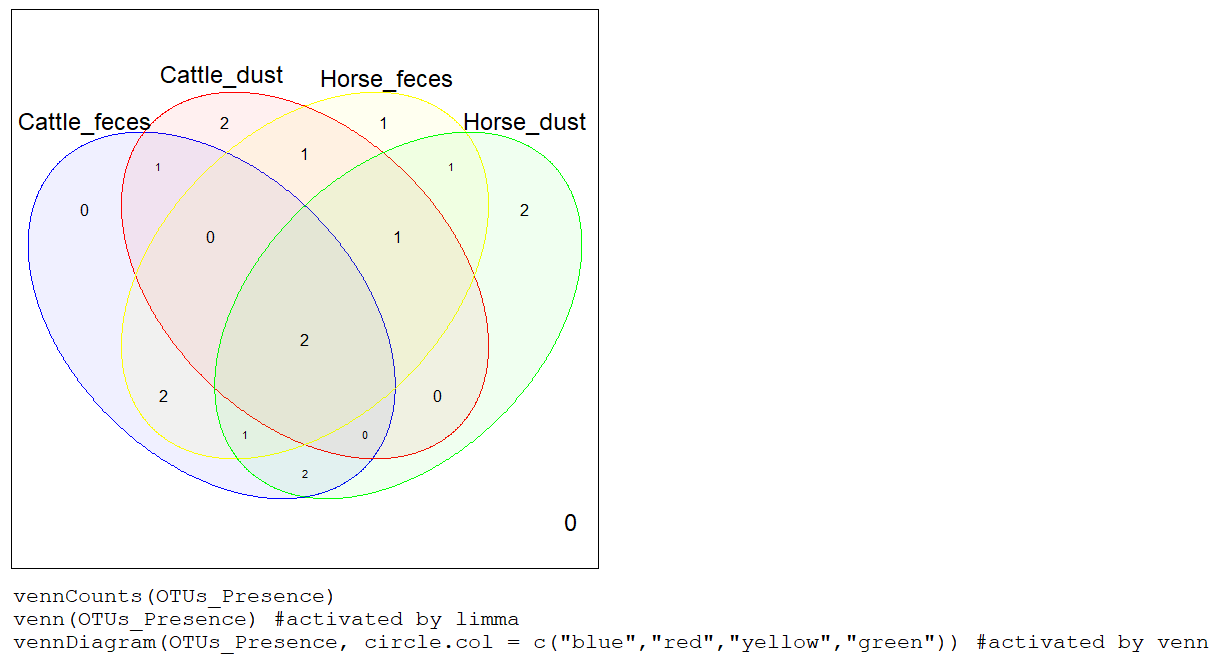
vennCounts(OTUs_Presence)
venn(OTUs_Presence) #activated by limma
vennDiagram(OTUs_Presence, circle.col = c("blue","red","yellow","green")) #activated by venn
|
